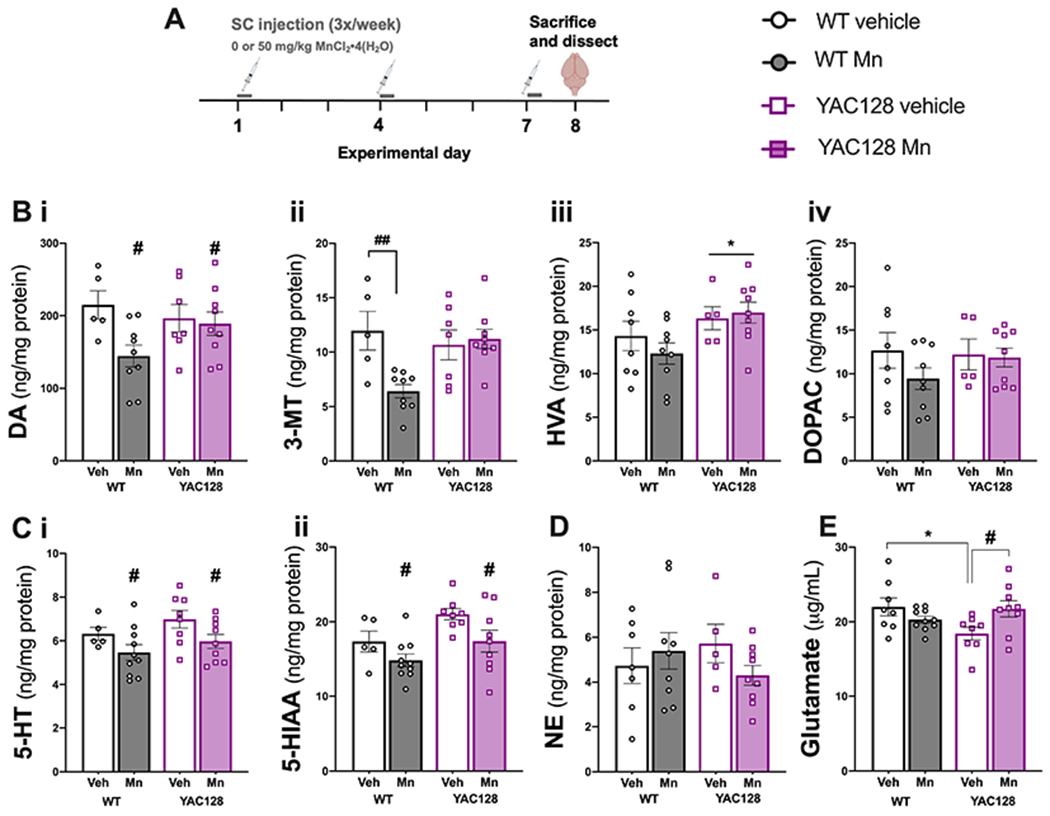
Figure 6. Neurotransmitter and metabolite measurements from dorsal striatum of middle-aged Mn-exposed mice.

(A) Experimental timeline. (B) Mn exposure decreased (i) dopamine (DA), (ii) Mn exposure decreased 3-MT in WT only, (iii) HVA was increased in YAC128 mice and (iv) there were no significant differences in DOPAC. (C) (i) 5-HT and its metabolite (ii) 5-HIAA were decreased in both genotypes by Mn exposure. (D) NE levels were not significantly different among groups. (E) Glutamate was significantly lower in YAC128 vehicle mice compared to WT vehicle. Mn exposure increased glutamate in YAC128 to levels not significantly different from WT vehicle. Data shown are mean ± S.E.M.. n=5-9 mice per group, approximately equal number males and females. *P<0.05 main effect of genotype, #, P<0.05, ##P<0.01 main effect of Mn treatment or differences between pairs of group data as marked with a horizontal bracket indicating significant Sidak’s post-hoc following a significant genotype x treatment interaction.
