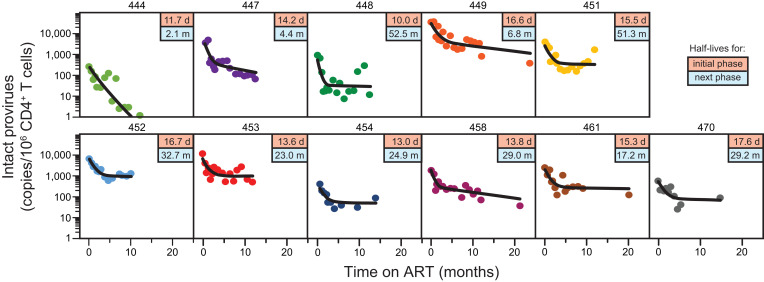
Fig. 3.
Biphasic decay of circulating CD4+ T cells with intact proviruses. IPDA measurements (circles) and the best-fit biexponential decay model (black line) are shown for 11 participants for whom samples were obtained throughout the first year of ART. Boxed values in the upper right of each panel are the half-lives for the initial phase (top, in days) and the next phase (bottom, in months) based on the model. Similar results were obtained for an additional four participants sampled for shorter periods of time (SI Appendix, Fig. S1). Samples for early time points for participant 441 were not available. Participant 460 had an unusual IPDA dot plot pattern suggestive of multiple expanded clones (SI Appendix, Fig. S2) and was not included for that reason.

