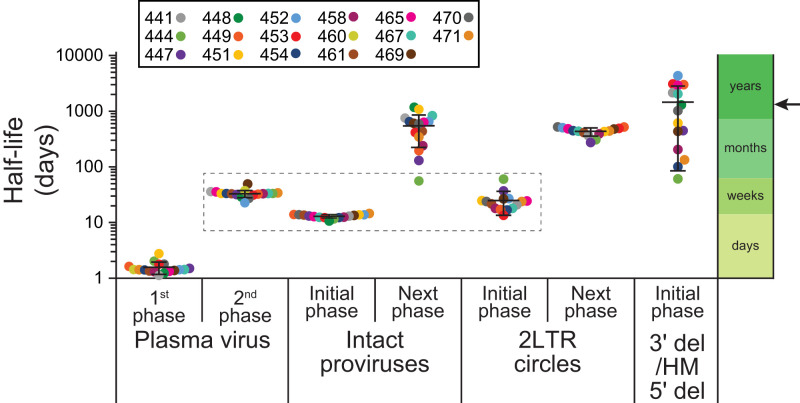
Fig. 5.
Comparison of the first- and second-phase half-lives for plasma virus, the initial- and next-phase half-lives for intact proviruses and env+ 2LTR circles, and the single-phase half-lives of defective proviruses. Half-lives are plotted on a logarithmic time axis. Bars show mean ± SD of the estimated individual parameter values based on all study participants. Participant 460 had an unusual IPDA dot plot pattern suggestive of multiple expanded clones (SI Appendix, Fig. S2) and was not included in the analysis of proviral decay. The second-phase decay of plasma virus is kinetically similar to the initial decay of cells with intact proviruses and cells with 2LTR circles (dashed box). Arrow indicates the half-life of latently infected CD4+ T cells in PLWH on long-term ART, as measured by the QVOA (12–14).

