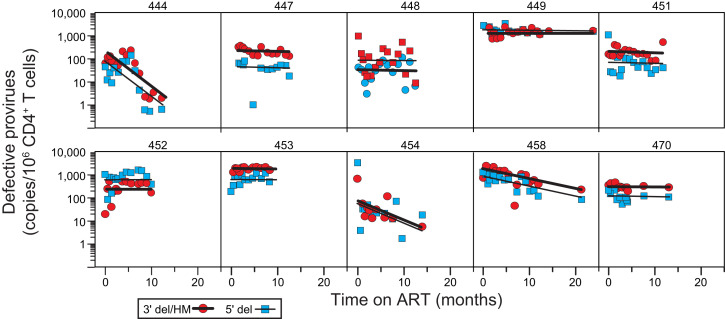
Fig. 6.
Decay of defective proviruses in circulating CD4+ T cells. Proviruses with 3′ deletions and/or APOBEC3-mediated hypermutation (red circles, thick black line) and proviruses with 5′ deletions (blue squares, thin black line) were separately quantitated as single positive droplets using the IPDA (Fig. 2A). Lines show the best-fit single-exponential decay model for each participant. Data are shown for participants for whom samples were obtained throughout the first year of ART. Decay parameters for all participants are given in SI Appendix, Table S6. Samples for early time points for participants 441 and 447 were not available. Defective proviruses could not be accurately measured for participant 461 over the background level of single positive events generated by DNA shearing. Baseline measurements of 3′ defective proviruses for participants 449 and 453 could not be made for the same reason. Participant 460 had an unusual IPDA dot plot pattern suggestive of multiple expanded clones (SI Appendix, Fig. S2) and was not included in the analysis of proviral decay.

