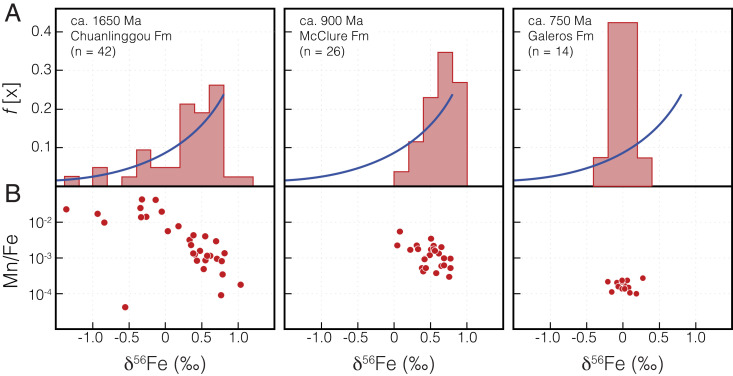
Fig. 3.
Iron isotope trends of selected Proterozoic ironstones. (A) Relative frequency histogram of δ56Fe values. For the Chuanlinggou ironstone, these values show a cluster around 0.8‰ with gradually decreasing relative frequency toward more negative values. For comparison, the dark blue line represents the δ56Fe distribution predicted for Fe(III) (oxyhydr)oxides produced by progressive oxidation according to Rayleigh distillation processes (e.g., ref. 68), assuming an initial Fe(II) source with δ56Fe = 0‰ and an instantaneous fractionation of 0.8‰ for the combined processes of Fe(II) oxidation and precipitation as Fe(III) (oxyhydr)oxides. For the McClure ironstone, δ56Fe values show a similar cluster around 0.8‰, but the tail of the distribution toward lower δ56Fe values is not as well-developed. For the Galeros ironstone, δ56Fe values cluster around 0‰ with a narrow range, interpreted to indicate quantitative oxidation of an unfractionated Fe(II) source. (B) Cross-plot diagram showing the relationship between Mn enrichment (Mn/Fe) versus δ56Fe values, a proxy for degree of oxidation. For the Chuanlinggou ironstone, these data show that more negative δ56Fe values are typically Mn-enriched and likely indicate a greater degree of water column oxidation. This trend is also less developed for the McClure ironstone, which lacks negative δ56Fe values, and is absent in the Galeros ironstone.

