Fig. 1.
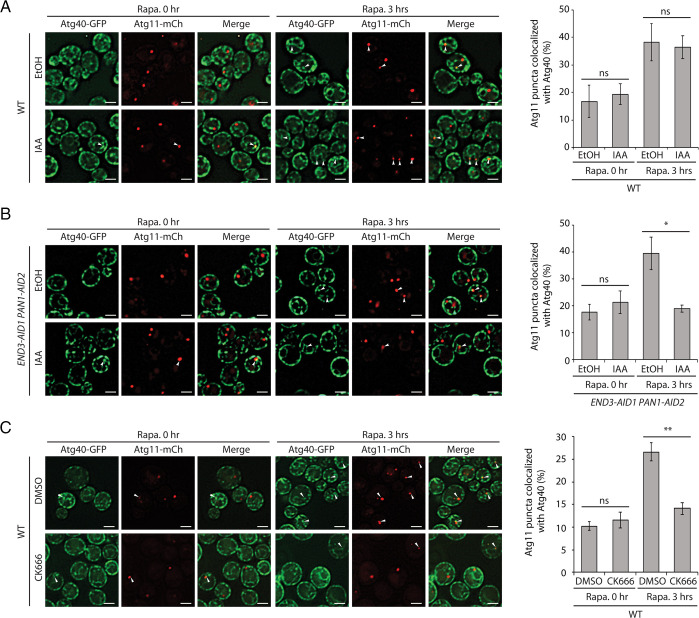
Induced degradation of End3 and Pan1 or inhibition of Arp2/3 with CK-666 inhibits the colocalization of Atg11 and Atg40. (A) Left: Fluorescence images of yeast cells expressing both Atg40-3xGFP and Atg11-2xmCherry before and after a 3-h treatment with rapamycin (Rapa.). Cells were pretreated with either EtOH or IAA for 90 min before the addition of rapamycin. The arrowheads point to Atg11 puncta that colocalize with Atg40 puncta. (Scale bars, 2 μm.) Right: The percentage of Atg11 puncta that colocalizes with Atg40 was quantified. Error bars represent SDs, n = 3 independent experiments. ns, nonsignificant (P ≥ 0.05); *P < 0.05; **P < 0.01. Student’s t test. (B) Left: Fluorescence images of yeast cells expressing End3-AID1, Pan1-AID2, Atg40-3xGFP, and Atg11-2xmCherry before and after 3-h rapamycin treatment. Cells were pretreated with either EtOH or IAA for 90 min before the addition of rapamycin. The arrowheads point to Atg11 puncta that colocalize with Atg40 puncta. (Scale bars, 2 μm.) Right: The percentage of Atg11 puncta that colocalizes with Atg40 was quantified. Error bars represent SDs, n = 3 independent experiments. ns, nonsignificant (P ≥ 0.05); *P < 0.05; **P < 0.01. Student’s t test. (C) Left: Fluorescence images of yeast cells expressing Atg40-3xGFP and Atg11-2xmCherry before and after 3-h rapamycin treatment. Cells were pretreated with either DMSO or CK-666 for 90 min before the addition of rapamycin. The arrowheads point to Atg11 puncta that colocalize with Atg40 puncta. (Scale bars, 2 μm.) Right: The percentage of Atg11 puncta that colocalizes with Atg40 was quantified. Error bars represent SDs, n = 3 independent experiments. ns, nonsignificant (P ≥ 0.05); *P < 0.05; **P < 0.01. Student’s t test.

