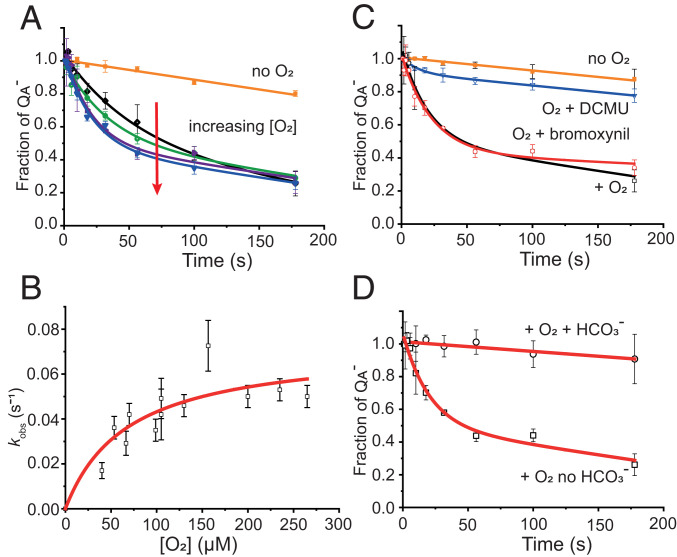
Fig. 2.
Kinetics of reoxidation by O2. Fraction of obtained after three saturating flashes of a degassed sample of PSII membrane fragments (60 nM PSII cores) in the presence of 250 µM hydroxylamine in a 40 mM MES buffer, 5 mM MgCl, pH 6.5. The data in A, C, and D were fitted to Eq. 1. (A) Orange symbols represent the decay in the absence of added oxygen, and the data were fitted with a linear decay. Other symbols represent the decay in the presence of oxygen in the concentration range from 40 ± 3 µM (black symbols) to 155 ± 6 µM (blue symbols). Data were fitted with Eq. 1. (B) Observed kinetic rate constants obtained from the fitting of the kinetic data with Eq. 1 plotted in function of the concentration of added oxygen. Data were fitted with the hyperbole of Eq. 2. (C) Effect of the addition of QB site inhibitors. Control experiments with (open black symbols) and without (closed orange symbols) oxygen are shown for comparison; 10 µM DCMU (open blue symbols) or 100 µM bromoxynil (open red symbols) was added prior to the degassing step and the kinetics were measured upon the addition of 110 ± 5 µM oxygen. (D) Effect of the addition of 1 mM bicarbonate (open circles) at the degassing step prior to the addition of oxygen is compared with a control kinetics in the absence of bicarbonate (open squares). Kinetics were recorded upon addition of 110 ± 5 µM oxygen.

