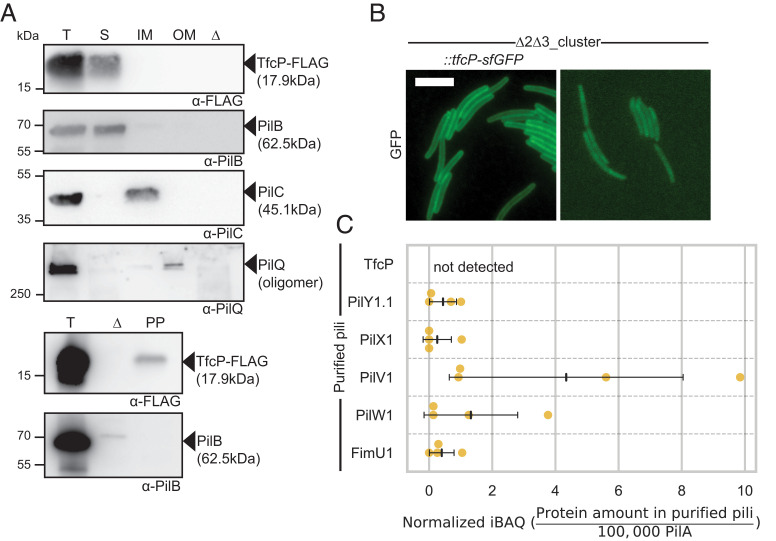
Fig. 4.
TfcP is a periplasmic protein. (A) Subcellular localization of TfcP-FLAG. Cells were grown in 1.0% CTT suspension culture and fractionated into fractions enriched for soluble proteins (S), IM proteins, and OM proteins (four Upper panels) or the periplasmic fraction (PP) (two Lower panels). T indicates total cell extract. In the lanes marked Δ, total cell extract of the ΔpilBTCMNOPQ mutant was used as negative control. Protein from the same number of cells was loaded per lane and analyzed by immunoblotting. PilB, PilC, and PilQ serve as controls for the fractionation and localize to the cytoplasm, IM and OM, respectively (12, 38). For PilQ, only the heat- and detergent-resistant oligomeric form is shown (39). (B) Determination of TfcP-sfGFP localization. Cells were grown in 1.0% CTT suspension culture, and analyzed as in Fig. 3C. WTΔ2Δ3 autofluorescence is shown as negative control. (Scale bar, 5 µm.) (C) Label-free quantification (LFQ) of cluster_1 proteins in purified pili. Pili were isolated from cells grown on 1.5% agar supplemented with 1.0% CTT. Normalized iBAQ (intensity based absolute quantification) values (SI Appendix, SI Materials and Methods) were determined in four biological replicates for WTΔ2Δ3ΔpilT and the negative control WTΔ2Δ3ΔpilTΔpilB. iBAQ values of WTΔ2Δ3ΔpilT were background corrected by subtraction of the mean iBAQ value of the four replicates of the negative control and rescaled to the iBAQ value of 100,000 PilA molecules in the same sample. Center marker and error bars: Mean and SD.

