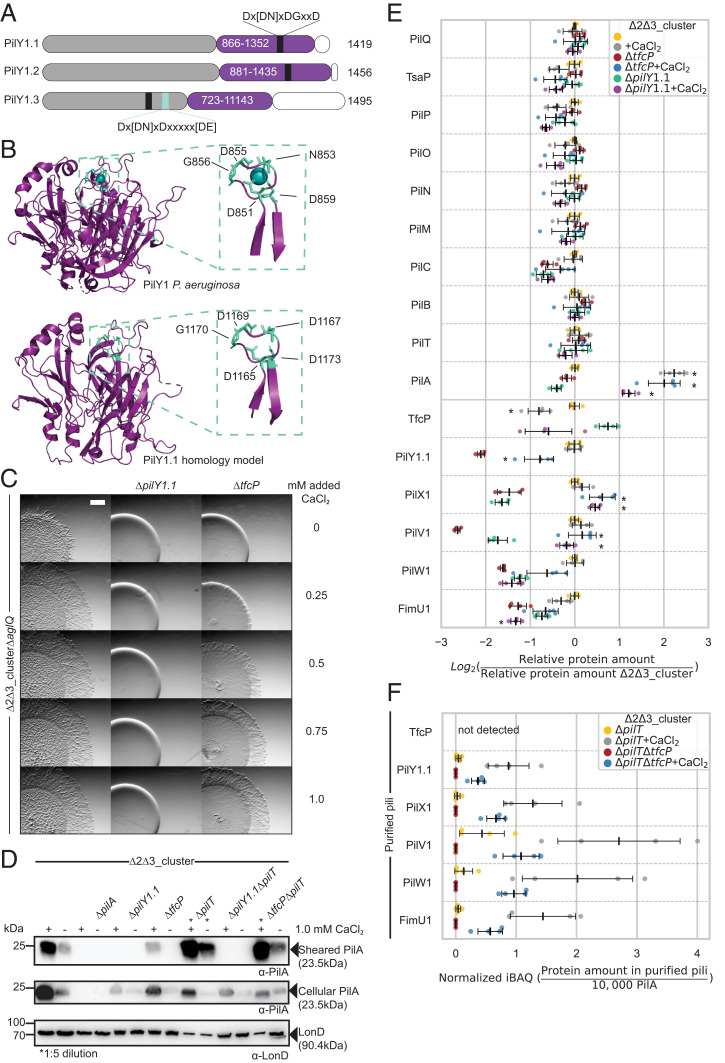
Fig. 6.
Added CaCl2 compensates for lack of TfcP. (A) Domain architecture of PilY1 proteins of M. xanthus. Purple, C-terminal PilY1 domain; gray, N-terminal domain; white; C-terminal sequences. EF-hand–like calcium binding motif is in black together with the consensus sequence; light blue box indicates second calcium binding motif in PilY1.3 together with the consensus sequence (25). (B) Comparison of PilY1 structure of P. aeruginosa (PDB 3HX6) (27) and a homology model of PilY1.1. Inset, zoom of calcium binding motif. (C) Assay for T4aPdM. Cells were grown in 1.0% CTT suspension culture and plated on 0.5% agar supplemented with 0.5% CTT and the indicated final concentrations of added CaCl2, and imaged after 24 h. Note that the flares formed by WTΔ2Δ3ΔaglQ are shorter than those formed by WTΔ2Δ3 due to the ΔaglQ mutation. (Scale bar, 1 mm.) (D) Shearing assay for T4aP formation. T4aP sheared off from ∼15 mg cells grown on 1.5% agar supplemented with 1.0% CTT and 1.0 mM CaCl2 as indicated, and analyzed as in Fig. 2B. (E) Accumulation of proteins of the T4aPM. Cells were grown in 1.0% CTT suspension culture without or with 1.0 mM added calcium as indicated. Proteins were quantified as in Fig. 3A. Data for samples without added CaCl2 are the same as in Fig. 3A and included for comparison. Statistical analyses were done by comparing cells grown in the presence versus the absence of calcium using Welch’s test, *P < 0.01. (F) LFQ proteomics of cluster_1 proteins in purified pili. Pili were isolated as in Fig. 4C after growth without or with added CaCl2 as indicated. Normalized iBAQ values were calculated as in Fig. 4C and background corrected by subtraction of the mean iBAQ value of the four replicates of the relevant negative control, and rescaled to 10,000 PilA molecules in the same sample. Data for WTΔ2Δ3 without added CaCl2 are the same as in Fig. 4C and included for comparison.

