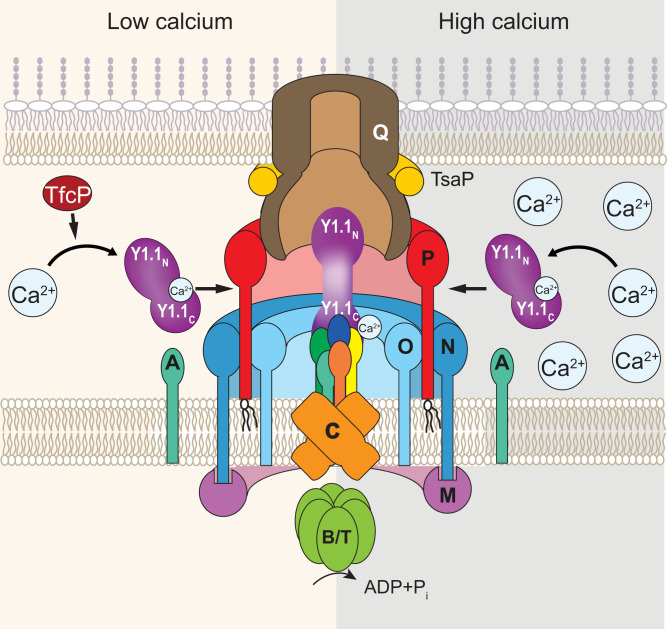
Fig. 8.
Model of TfcP function at low- and high-calcium concentrations. For simplicity, PilB and PilT are not indicated separately. Y1.1N and Y1.1C indicate the N- and C-terminal domains of PilY1, respectively. The color code for the four minor pilins is as in Fig. 1B.

