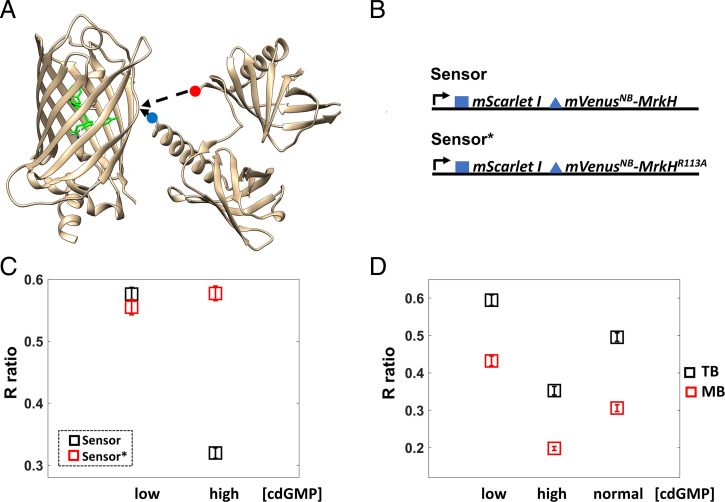
Fig. 1.
Biosensor development and validation. (A) The MrkH insertion into the mVenusNB β-barrel is depicted. The image was generated in UCSF Chimera (49) using 1HUY.pdb for mVenusNB and 5KEC.pdb for MrkH. The red dot marks the amino terminus, and the blue dot marks the carboxyl terminus of MrkH. The amino acids that make up the chromophore are highlighted in green. (B) A diagram of the expression system is shown; the blue square represents the T7 phage ribosome-binding site, and the blue triangle represents the less efficient ribosome-binding site (GGAACAGAC sequence). Both mScarletI and the mVenusNB–MrkH fusion are expressed using the same promoter (proC, black arrow). The Sensor* platform contains the MrkH R113A mutation that abolishes c-di-GMP binding. Thus, only the Sensor platform is expected to be c-di-GMP responsive. (C) The Sensor platform is validated in cells grown exponentially in TB and added directly to channel slides. The average ratio (R) of mVenusNB to mScarletI fluorescence emissions is plotted for cell populations expressing the Sensor (black squares) or the Sensor* platform (red squares) overexpressing either the phosphodiesterase PdeH (low intracellular c-di-GMP) or the diguanylate cyclase WspR:D70E (high intracellular c-di-GMP). Each square represents the average measurement for 179 cells, and brackets represent 95% CIs. Notice that the Sensor platform R ratio is sensitive to changes in c-di-GMP concentration, in contrast to the Sensor*’s R ratio. A decrease in the Sensor R value corresponds to an increase in c-di-GMP concentration. (D) Cells in TB have higher internal pH than cells in motility buffer (MB), and the Sensor’s R values vary accordingly. Black squares represent the average measurements in TB and red squares the average measurements in motility buffer. More than 126 cells were measured for each average, and the brackets represent 95% CIs.

