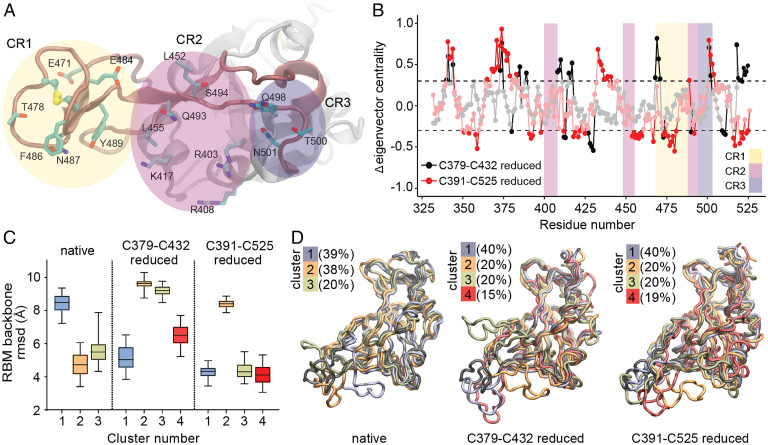
Fig. 5.
MD simulation of SARS-CoV-2 RBD disulfides. (A) Detailed representation of RBM residues in RBD that directly interact with ACE2, grouped in three contact regions (CRs). (B) Eigenvector centrality difference between reduced and native states. CR regions are colored as in A. Residues two σ-units away from normal distribution (dashed line) are shown. (C) Distribution of the root mean square deviation (rmsd) with respect to the experimental RBM structure for each ensemble of clustered structures. (D) Superposition of the reference RBD structure (black) with a representative RBD structure of each cluster ensemble from different simulations. The percentage of structures belonging to each cluster is indicated.

