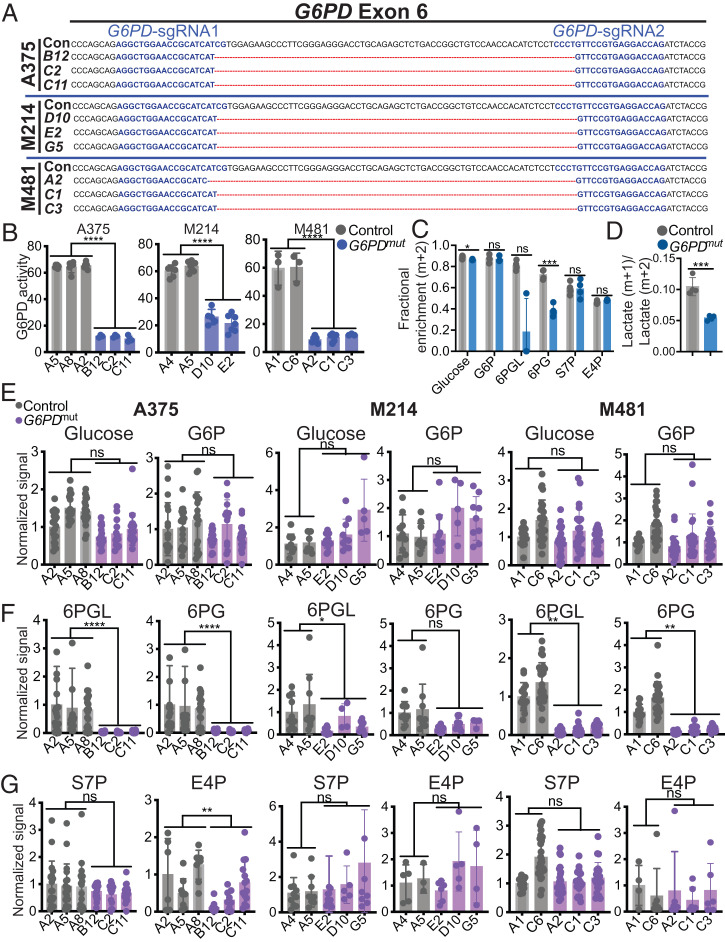
Fig. 2.
Generation of G6PD mutant melanoma cells with impaired oxidative pentose phosphate pathway function. (A) CRISPR editing of G6PD in three melanomas (A375, M214, and M481) to generate three independently targeted clones per melanoma with 66- to 68-bp deletions in exon 6. A375 was derived from a female patient while M214 and M481 are from males. Guide sequences are highlighted in blue. The 66- to 68-bp region deleted in the mutants is depicted by red lines. The control (Con) sequence is shown for reference. (B) G6PD enzymatic activity in subcutaneous tumors formed by G6PD mutant or control melanoma cells. (C and D) Tracing of [1,2-13C] glucose in G6PD mutant or control A375 melanoma cells to assess the activity of the pentose phosphate pathway. The data show the fractional enrichments (m+2) in glucose, G6P, 6PGL, 6PG, E4P, S7P (C) and the ratio of m+1 lactate to m+2 lactate (D) 4 h after adding labeled glucose to culture. (E–G) Analysis of the relative levels of glucose, G6P, 6PGL, 6PG, and S7P, and E4P levels in subcutaneous tumors formed by G6PD mutant and control A375 (Left), M214 (Center), and M481 (Right) melanoma cells (n = 5 to 8 tumors per clone). Each dot represents a different tumor from a different mouse. Data represent mean ± SD. Statistical significance was assessed using linear mixed-effects analysis (B), linear mixed-effects analysis on log2-transformed data (E–G), Student’s t tests (D), or Mann–Whitney U tests (C). Statistical tests were two-sided. Multiple comparisons were adjusted by the FDR method. *P < 0.05, **P < 0.01, ***P < 0.001, ****P < 0.0001, ns = not significant.

