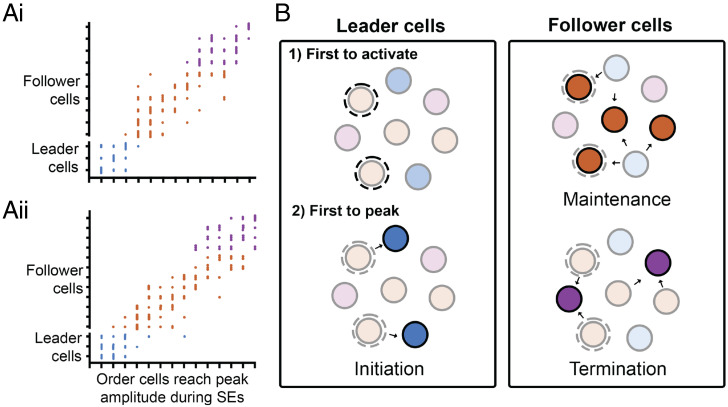
Fig. 6.
Predicted model for the temporal ordering of KNDy neuron activation during SEs. (A) Scatterplots mapping the order of cell activity during SEs from 60-min recordings from two representative animals. Each dot represents the order in which a cell reached peak amplitude during an SE. KNDy neurons have been divided into “leader” and “follower cells” depending on their order of activation across multiple SEs and color-coded into the categories shown in B. (B) Schematic depicting the predicted temporal activation of KNDy neurons that drives LH pulsatile release. First, a population of leader cells first initiate an LH pulse (1) by exhibiting an increase in activity toward threshold and driving activation of a subpopulation of leader cells that peak first (2, blue cells), which activates reciprocally connected follower cells. Follower cells are further divided into cells that peak during the maintenance (orange cells) and termination (purple cells) phase of the KNDy/GnRH/LH pulse.

