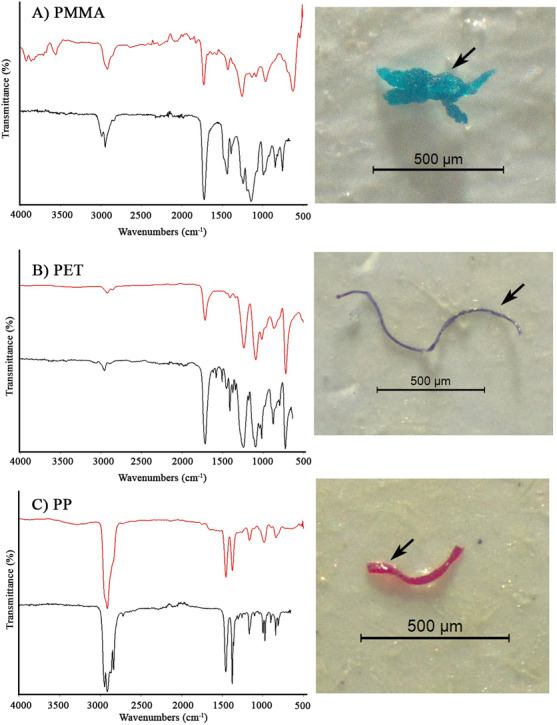
Figure 4. FTIR spectra of representative MP polymers.

The red spectrum is that of the FT-IR measurement, while the black spectrum is the reference spectrum from the Bruker spectrum library. The black arrows in the photographs indicate the particles that were identified.
