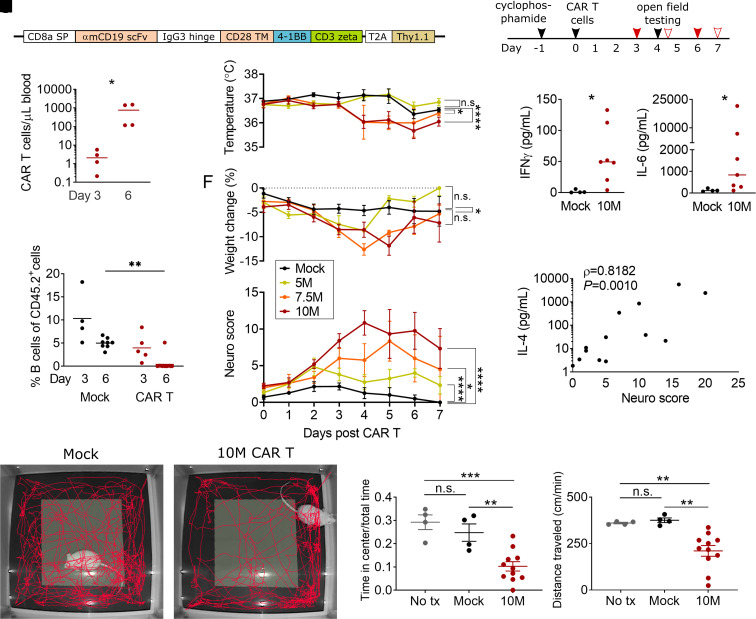
Figure 1.
Neurotoxicity and CRS after CAR T-cell treatment. (A) Structure of the murine CD19-directed CAR. SP, signal peptide; TM, transmembrane domain. (B) Experimental scheme. The solid red arrows show the timing of blood draws for flow cytometry; outlined red arrows show blood draws for adhesion molecule and cytokine analysis. (C) CAR T cells (CD3+ Thy1.1+) in blood by flow cytometry. X-axis denotes day after CAR T-cell injection. Mice received either 5, 7.5 or 10 × 106 cells/mouse. (D) CD19+ B cells as a fraction of total CD45+ splenocytes. Depletion by CAR T cells is completed by Day 6. (E) Ear temperature, (F) body weight and (G) neurologic exam scores in the first 7 days after CAR T-cell infusion, P-values were calculated by linear mixed models (mixed-effects analysis). (H) Serum levels of interferon-γ on Day 4 after treatment with 10 million CAR T cells (10M) or control T cells (Mock). (I) Serum levels of IL-6. (J) Correlation of IL-4 serum levels and same-day neuro score, Spearman’s r. Representative examples of 5 min tracks in the open field for a CAR T-cell-treated (K) and mock T-cell-treated (L) mouse. (M, N) Open-field test. ‘No tx’ are naïve control mice who received no cyclophosphamide or CAR T cells. Y-axis denotes the fraction of time spent in the centre of the arena (M) and locomotion speed (N) during the 5 min test. (C, D, M, N) Lines show the mean, statistics by one-way ANOVA with the Holm–Sidak post-test. (H, I) Lines show the median, Mann–Whitney test. All panels: *P < 0.05, **P < 0.01, ***P < 0.001, ****P < 0.0001, all other comparisons are P ≥ 0.05. Each data point denotes one animal, except E–G where each data point shows the mean of five or more animals per group, with some time points having missing values from some animals. All data pooled from three or more independent experiments.

