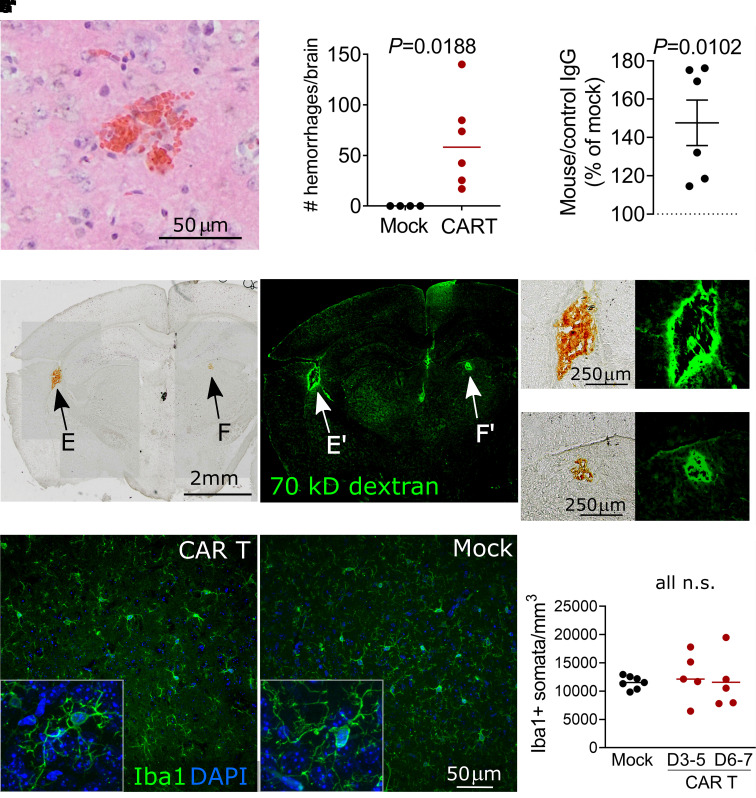
Figure 2.
Cerebral microvascular injury during neurotoxicity. (A) Acute microhaemorrhage in the dorsal cortex. H&E-stained brain section from a mouse that received 10 × 106 CAR T cells 4 days prior. (B) Quantification of brain microhaemorrhages in the entire brain. (C) Quantification of anti-mouse IgG immunofluorescence normalized to control species IgG immunofluorescence. Each data point shows the median of three brain sections from one mouse, normalized to concurrently treated controls receiving mock transduced T cells. CAR T-cell-treated mice received 5, 7.5 or 10 × 106 CAR T cells 4–6 days prior to sacrifice. (D) Bright field image of coronal brain section from a CAR T-treated mouse that received i.v. FITC-dextran 30 min prior to sacrifice. Arrows indicate microhaemorrhages, which are visible without additional tissue staining. (D′) Fluorescence imaging of the same section, demonstrating FITC-dextran extravasation surrounding the haemorrhages. (E′) Magnification of subcortical haemorrhage in C. (F) Magnification of basal ganglia haemorrhage. (E′, F′) The corresponding fluorescence images. (G, G′) Representative immunofluorescence of microglia in the somatosensory cortex labelled with anti-Iba1 antibody. Insets show individual microglial cells with processes at 40× magnification. In the CAR T-treated mouse (G), the microglia maintain a similar finely ramified resting appearance as mock controls (G′). (H) Quantification of microglial somata counts. All graphs: each data point represents one mouse, pooled data from three experiments and lines show mean. Statistical analyses used: (B, C) one-sample two-tailed t-test. (H) One-way ANOVA with Holm–Sidak post-test.

