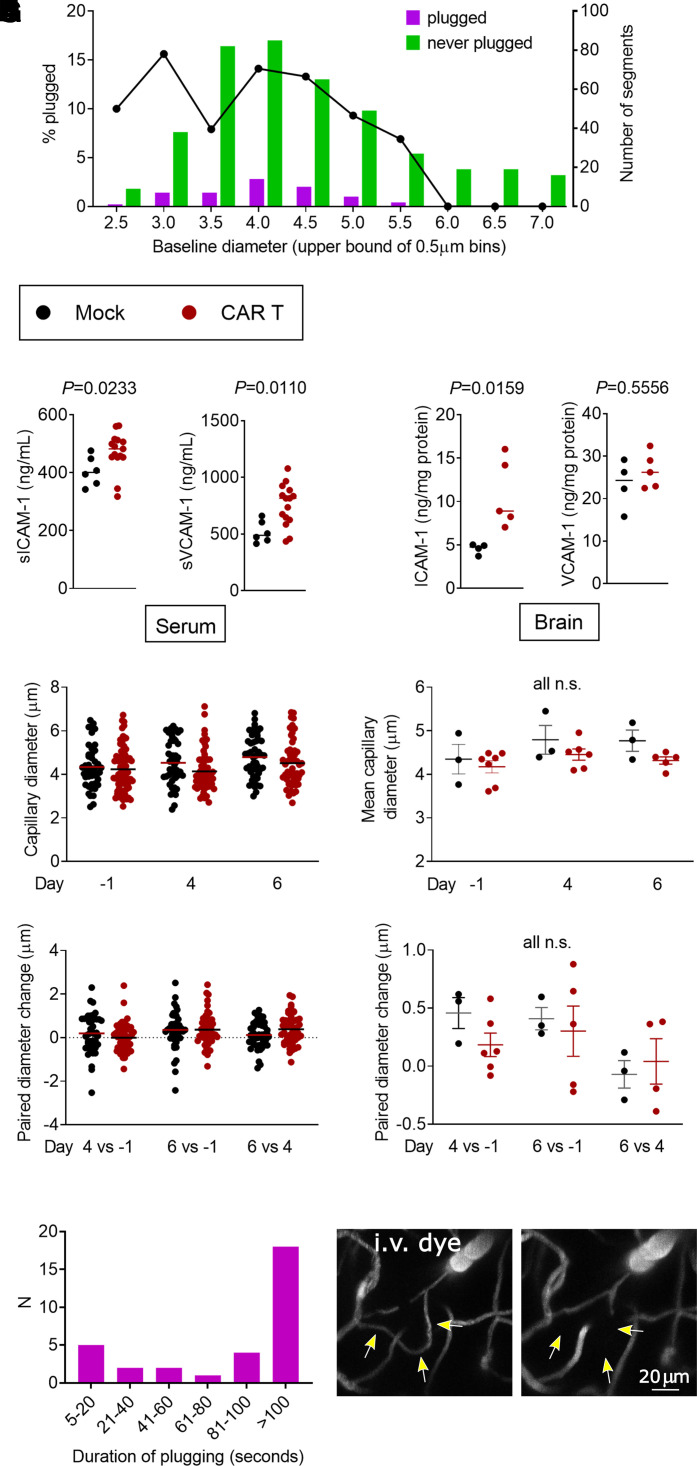
Figure 6.
Adhesion molecule expression and kinetics of capillary plugging. (A) Baseline diameters (Day 1) and likelihood of plugging on Days 4 and/or 6. Left y-axis and line plot show the percentage of capillaries that had any plugging. The right y-axis and bar graphs show the raw counts of capillary segments in each size bin. Each bar represents a single measurement from pooled data from six mice, each treated with 10 million CAR T cells and Days 4 and 6 time points. (B–G) Black dots, mock; red dots, CAR T-cell-treated mice. (B) Serum levels of soluble VCAM-1 and VCAM-1. (C) Protein content of ICAM-1 and VCAM-1 in brain lysates. For B and C, each data point represents one mouse, the lines show the median, P-values per Mann–Whitney test. (D) Representative example of capillary diameters in one CAR T (red) and one mock (black)-treated mouse. Each data point represents one capillary segment, all segments <7 μm baseline diameter in 3 z-stacks were included. Line denotes the mean diameter. (E) Summary of mean capillary diameters from three separate experiments, each data point represents one mouse. Lines show mean and SEM, one-way ANOVA. (F) Representative example of diameter changes in individual capillary segments in the same animals as in D, each data point is one capillary segment and line denotes the mean. (G) Summary plot of diameter changes over time, each data point shows the mean from one mouse and lines show mean and SEM, one-way ANOVA. (H) Duration of plugging. Bars show the number of capillary plugs that persisted for the amount of time indicated on the x-axis. For plugs lasting <100 s, both the beginning and the end of the stalling event were observed. Each bar represents a single measurement from pooled data from five mice at Days 4 and 6 time points. (I, J) Rare loss of a capillary segment. Arrows show a flowing segment on Day 1 (I), which no longer fills with dye on Day 6 (J).

