FIGURE 3.

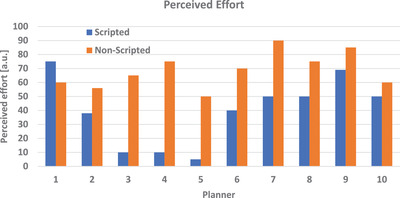
Comparison of perceived effort per planner. Perceived effort was scaled from 1‐minimal effort to 100‐maximum effort and was subjective to each planner. Scripted plans (blue) vs. non‐scripted plans (orange)

Comparison of perceived effort per planner. Perceived effort was scaled from 1‐minimal effort to 100‐maximum effort and was subjective to each planner. Scripted plans (blue) vs. non‐scripted plans (orange)