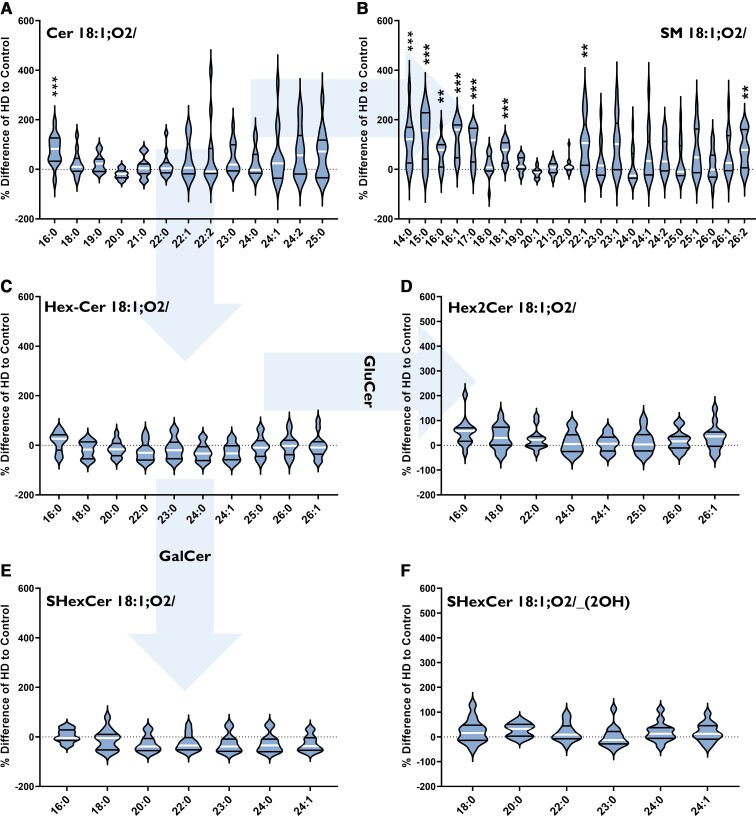
Figure 3.
Percentage differences of (A) Cer, (B) SM, (C) HexCer (GluCer, GalCer), (D) Hex2Cer (lactosylceramide), (E) SHexCer and (F) OH-SHexCer species in the putamen of HD subjects (n = 13) compared to controls (n = 12). The labels below each violin refer to the fatty acyl chains attached to each lipid class (in bold). Arrows indicate metabolic pathways. Percentage differences were calculated as {[(HD–Control)/(Control)] × 100}. Data were assessed for normality using a D’Agostino Pearson Omnibus test and analysed using an unpaired t-test with Welch’s correction or Mann–Whitney U-test where appropriate. The violin plots show the distribution of values, medians (white line) and quartiles (first and third). Accepted significance was set at P < 0.01. **P < 0.01, ***P < 0.001. Statistical test details, including exact P-values, can be found in Supplementary Tables 15–19. Cer, ceramide; HD, Huntington’s disease; GalCer, galactosylceramide; GluCer, glucosylceramide; SM, sphingomyelin.

