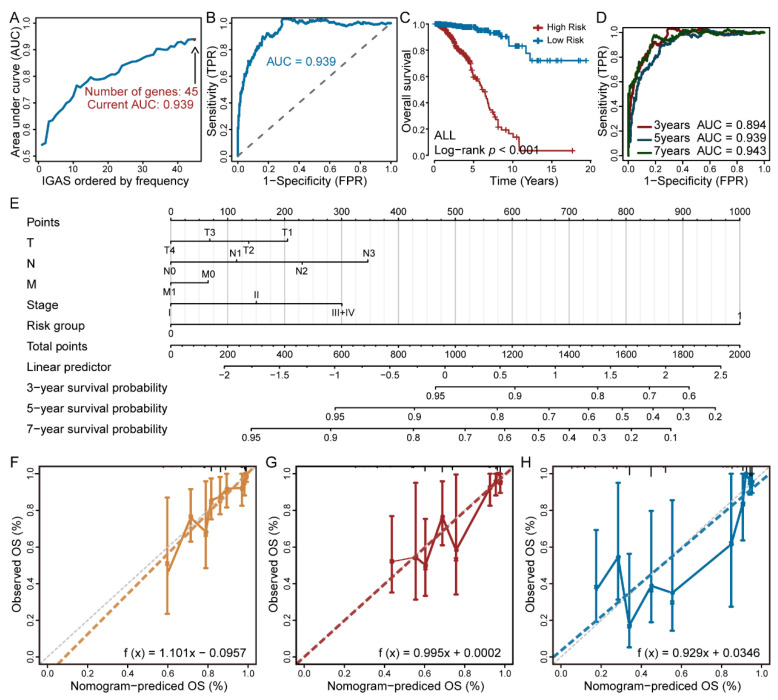
Figure 2.
Construction and validation of the IGAS prognostic model in predicting overall survival of breast cancer. (A) During the construction of the final IGAS prognostic model, the AUC values were calculated when selecting different prognosis-related IGAS events. (B) Maximum AUC value in ROC curves and the number of optimal prognosis-related IGAS events in the final IGAS prognostic model. (C) Kaplan-Meier curve of the final IGAS prognostic model. (D) The ROC curves with AUCs at 3-year, 5-year, and 7-year of the final IGAS prognostic model, respectively. (E) IGAS-clinic nomogram for the IGAS risk groups and clinicopathological characteristics predicting 3-year, 5-year, and 7-year overall survival. (F–H) The calibration curves for the 3-year, 5-year, and 7-year overall survival predictions, respectively.

