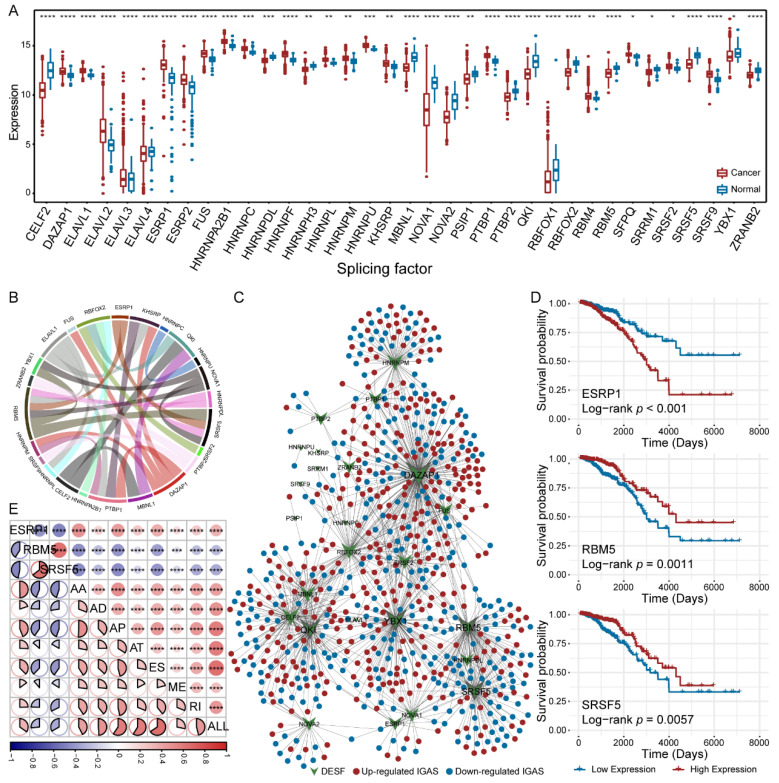
Figure 3.
AS regulatory network. (A) The difference of expression of the DESFs between primary breast cancer and corresponding adjacent normal tissues. The asterisk character represents the significance of the expression discrepancy. (B) The co-expression relationships between DESFs. (C) AS regulatory network of IGAS events and DESFs. Ellipse nodes indicate IGAS events that were up-regulated (red dots) or down-regulated (blue dots), and V nodes indicate SFs that were differentially expressed. (D) Kaplan-Meier curves of survival-related SFs (ESRP1, RBM5, and SRSF5), respectively. (E) The correlation between the risk scores of prognostic models and the expression of survival-related SFs. The size and color of the circle or pie represent the weight and tendency of the correlation coefficient, respectively. The asterisk character represents the significance of the difference or correlation coefficient, * p < 0.05; ** p < 0.01; *** p < 0.001; **** p < 0.0001.

