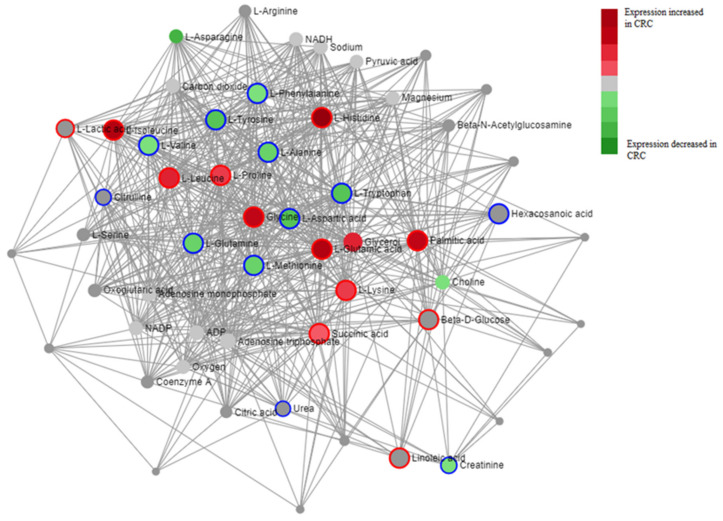
Figure 4.
Diagram depicting a metabolite–metabolite interaction network for major metabolites identified to be differentially regulated across studies. Map was created using MetaboAnalyst’s network analysis feature, using a degree filter of 5.0 and betweenness cutoff of 2.0. Color of metabolite represents directionality of difference between CRC and control in literature (Difference was calculated by number of papers identifying metabolite as upregulated—number of papers identifying metabolite as downregulated). Nodes are connected utilizing the KEGG database of metabolic pathways, with larger nodes being implicated in more pathways and thus having more connections. Outline of metabolite represents pathways that are up or downregulated in CRC, analyzed using the KEGG database, with blue-outlined metabolites representing pathways downregulated in CRC and red-outlined metabolites representing pathways upregulated in CRC.

