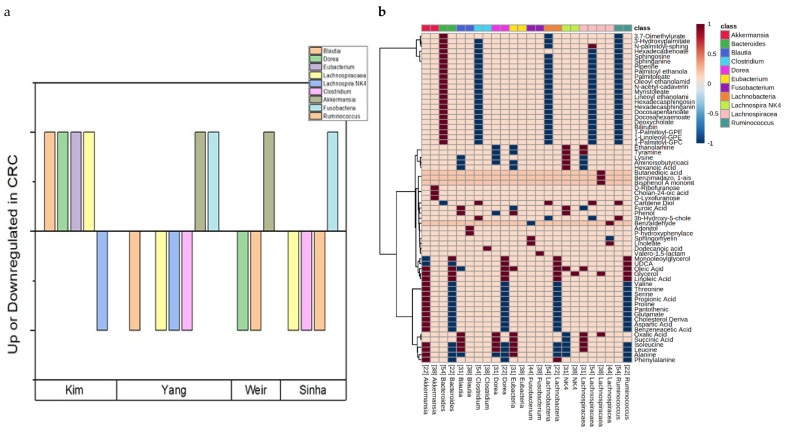
Figure 5.
(a) Graphical representation of bacterial genera identified to be differentially regulated in multiple studies over four studies reporting that data [33,37,44,48]. A bar above the x axis indicates upregulation of that bacterial genus in CRC fecal tissue, while a bar below the x axis indicates downregulation. (b) Heatmap demonstrating the identified Pearson correlation of bacterial genus identified as differentially regulated in multiple sources and identified metabolites in five studies [33,34,37,44,48], using stool as the primary specimen. A positive (>0) value on the heatmap implies a positive correlation between bacterial genus and metabolite, while a negative (<0) value implies negative correlation between the genus and that metabolite. A 0 indicates no reported correlation for that metabolite.

