Figure 5.
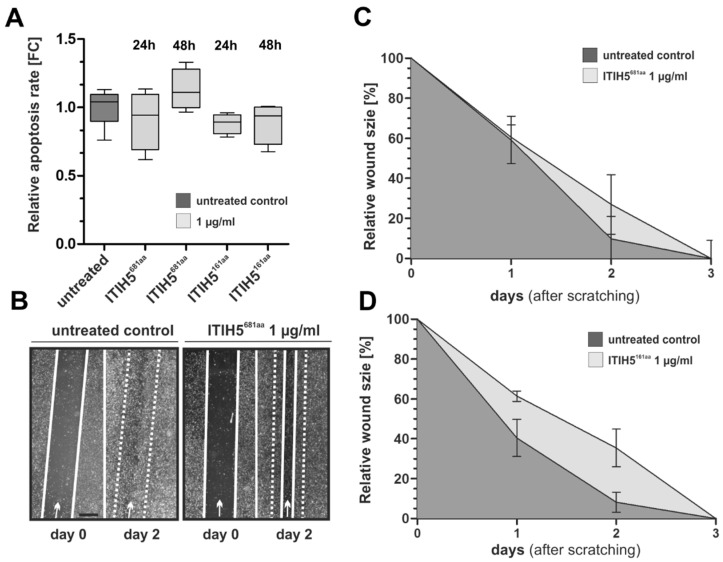
The impact of ITIH5681aa and ITIH5161aa treatment on the apoptosis and motile characteristics of MDA-MB-231 breast cancer cells. (A) Caspase 3/7 activity as an indicator of apoptosis in MDA-MB-231 cells either treated with ITIH5681aa (1 µg/mL) or ITIH5161aa (1 µg/mL) for 24 h and 48 h. The box plot shows the relative apoptosis rate. Horizontal lines: grouped medians. Boxes: 25–75% quartiles. Vertical lines: range, minimum and maximum. (B–D) Cell migration was analyzed by using a wound healing assay. (B) Representative wound area documentation by light microscopy 0 and 48 h after scratching. White line: cell-free wound area. White dashed line: original wound area size at 0 h. Original magnification 50×. (C,D) The mean migration rate of an untreated (PBS) control cell set and MDA-MB-231 cells treated with either (C) ITIH5681aa (1 µg/mL) or (D) ITIH5161aa (1 µg/mL) was analyzed over 3 days. Vertical lines: standard deviation (S.D.) of triplicates. The cell-free area on Day 0 was set as 100% and used for standardization.

