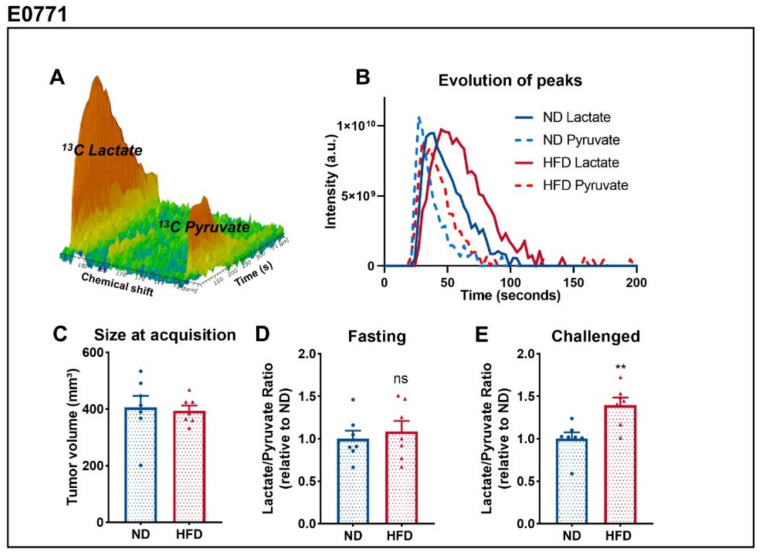
Figure 2.
Breast tumors of obese mice display higher lac/pyr ratio than tumors of lean mice. (A) Representative MRS spectrum after injection of hyperpolarized 1-13C pyruvate acquired in vivo. (B) Representative evolution of 13C pyruvate and 13C lactate peaks over the time, from which the area under the curve and ratios are calculated. (C) Tumor size at the time of HP 1-13Cpyruvate-to-lactate spectra acquisition of E0771 tumors measured by T2-weighted MRI images. (D) Calculated Lac/Pyr ratio in fasted mice and (E) mice challenged with glucose. Sample size: n = 7 for ND and n = 7 for HFD, failure to acquire spectrum from a mouse from HFD. Statistical analysis: unpaired t-test; ns p > 0.05; ** p < 0.01.

