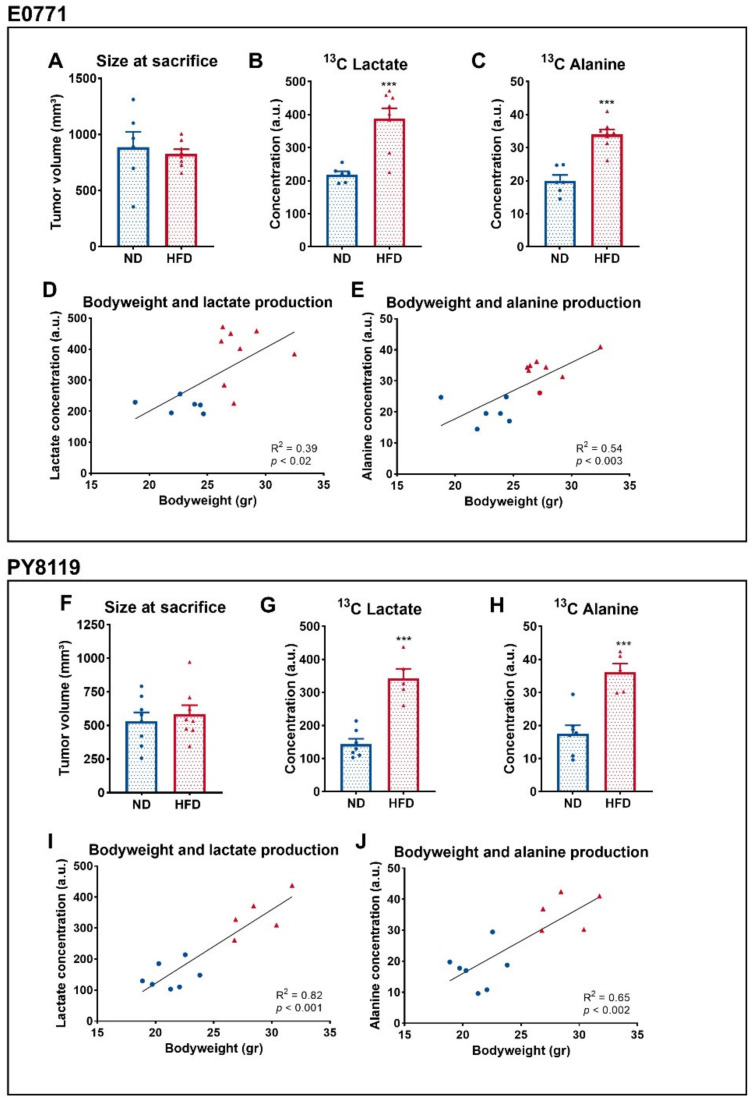
Figure 3.
Breast tumors of obese mice produce more lactate than tumors of lean mice. (A–E): E0771 cell line; sample size: n = 6 for ND and n = 8 for HFD. (F–J): PY8119 cell line; sample size: n = 7 for ND and n = 5 for HFD. (A,F) Tumor size at the time of the necropsy. (B,G) 13C lactate and (C,H) 13C alanine concentrations from tumor extracts. (D,I) Correlation curve between the bodyweight of the mice and tumor 13C lactate (E) and 13C alanine (F,J) production. Statistical analysis: unpaired t-test; *** p < 0.001.

