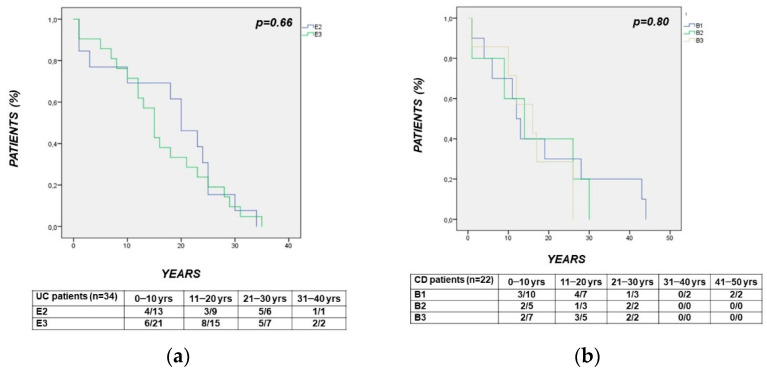
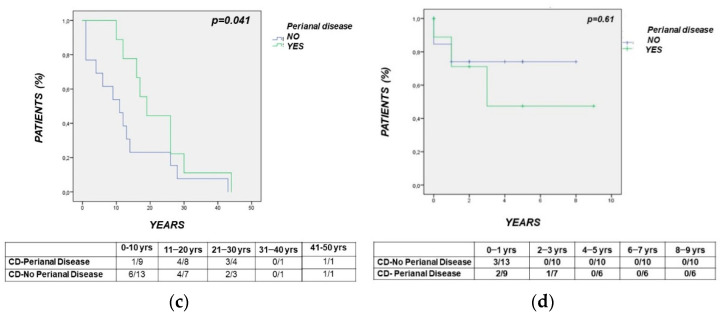
Figure 2.
(panels a–d): Survival curves showing the time interval from: panel (a). Diagnosis of UC to diagnosis of CRC, comparable between patients with left-sided vs. extensive UC (E2 vs. E3: p = 0.66); panel (b). Diagnosis of CD to diagnosis of CRC, comparable between patients with different CD behaviors (B1 vs. B2 vs. B3: p = 0.80); panel (c). Diagnosis of CD to diagnosis of CRC, significantly longer in patients with vs. without perianal (PA) disease (p = 0.04); panel (d). Diagnosis of CRC to CRC-related death, comparable between CD patients with vs. without PA disease (p = 0.61).


