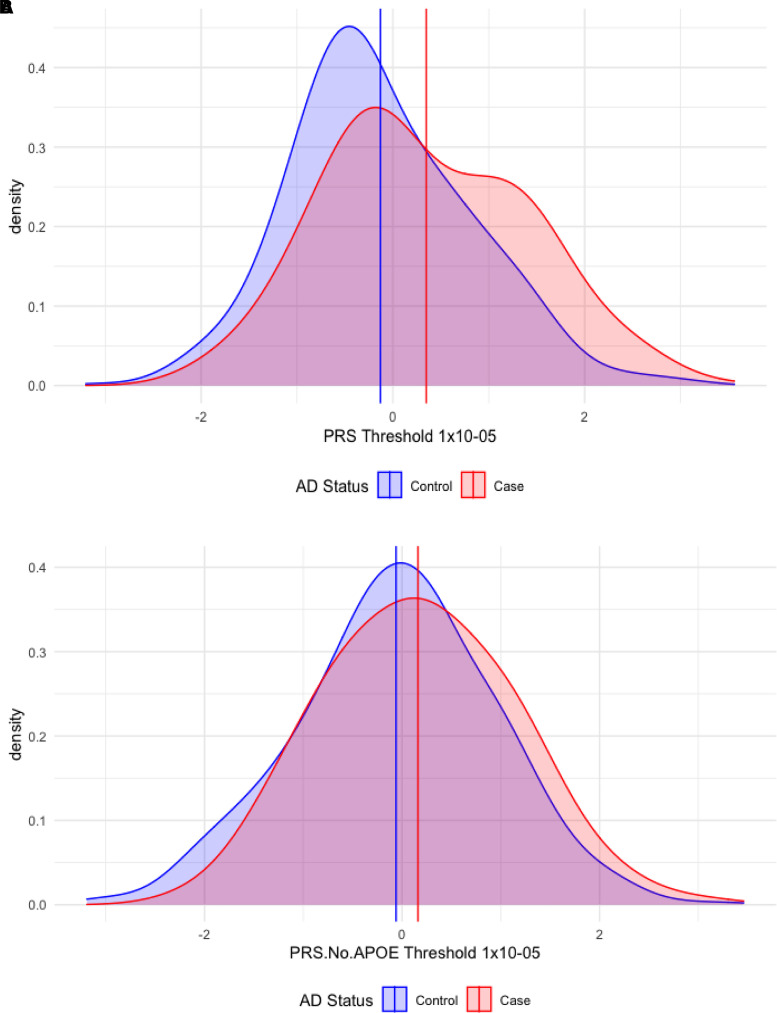
Figure 2.
Density plots of Alzheimer’s disease PRSs at the P < 1 × 10⁻⁵ threshold in cases and controls. (A) PRS. (B) PRS.no.APOE (PRS without APOE region). PRS, polygenic risk score. Vertical lines indicate the mean PRS values for Alzheimer’s disease (AD) cases (red line) and controls (blue line). PRSs are based on independent genetic variants reaching a significance threshold of P < 1 × 10⁻⁵ in the GWAS.

