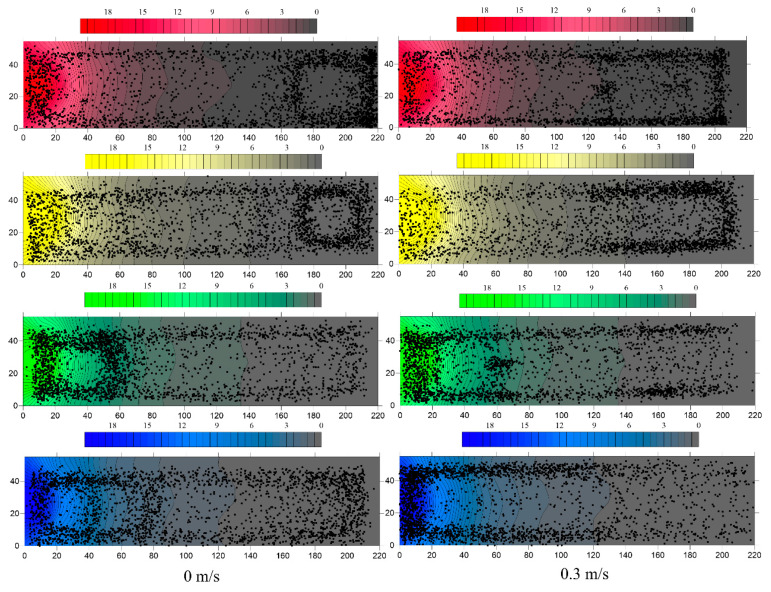
Figure 7.
Distribution trajectories of the fish in red, yellow, green, and blue light at flow rates of 0 m/s and 0.3 m/s. The y-axis and x-axis are the length of the water tank in millimeters. The bar graph at the top represents the color change corresponding to the range of light intensity. The black points in the graph are the trajectories of the fish during the test period, and one black point represents one second.

