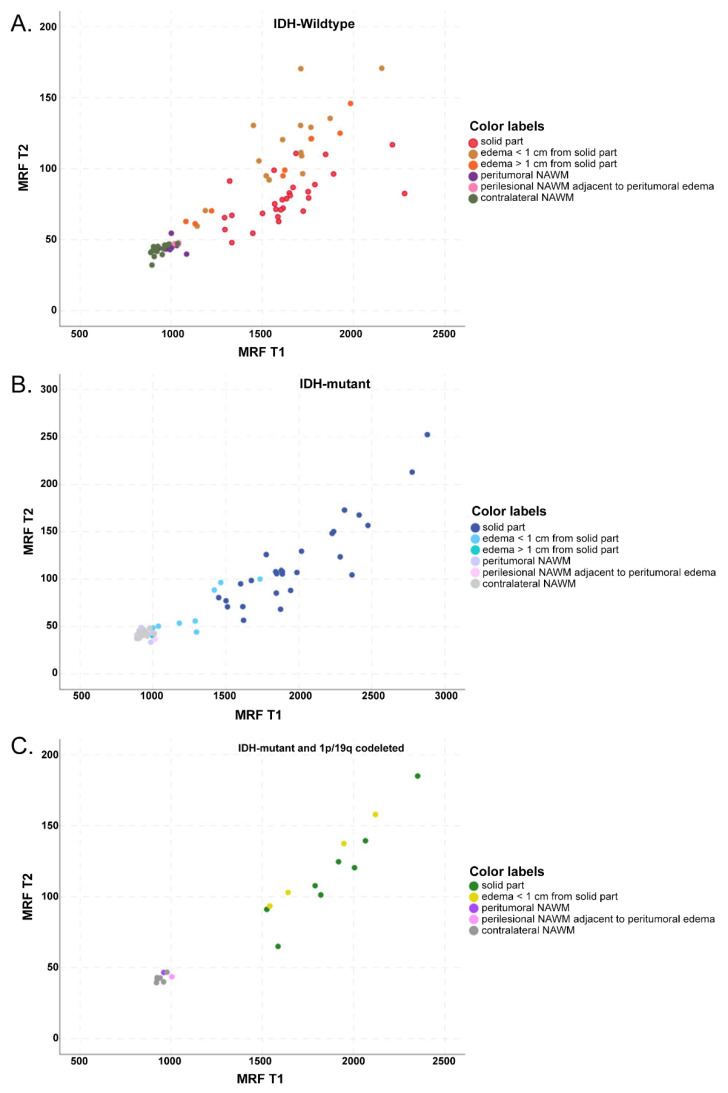
Figure 6.
Scatterplot of MRF T1 and T2 relaxation time values in IDH-wildtype (A), IDH-mutant (B), and IDH-mutant 1p/19q codeleted gliomas (C) from different types of tissue (solid part of the tumor; peritumoral edema ≤ 1 cm distant from the tumor and > 1 cm distant from the tumor; perilesional NAWM ≤ 1 cm distant from the tumor or peritumoral edema; and contralateral NAWM). Significant difference for MRF T1 and T2 between solid parts of the tumor and NAWM in the IDH-wildtype and IDH-mutant, including 1p/19q-codeletion. Also notice the significant difference for MRF T1 and T2 between solid tumor components and peritumoral edema in IDH-mutant, and for MRF T2 between solid tumor components and peritumoral edema in the IDH-wildtype (when divided into sub-specified areas of peritumoral edema, significant only in edema ≤ 1 cm distant from the solid part).

