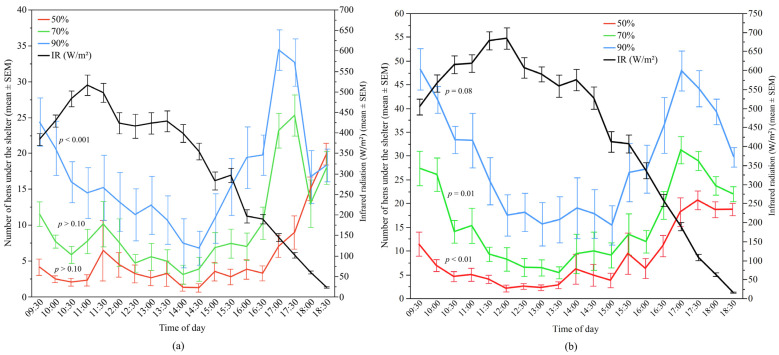
Figure 10.
The mean (±SEM) number of hens under the different UV-filtering shelters (50%, 70%, and 90%) and the mean (±SEM) infrared radiation (IR) throughout the day: (a) Flock-A; (b) Flock-B (p > 0.10 indicates the variable had no significant effect and was removed from final model). Note the different Y-axis scales between Flock-A and Flock-B. Raw values are presented with analyses conducted on transformed data.

