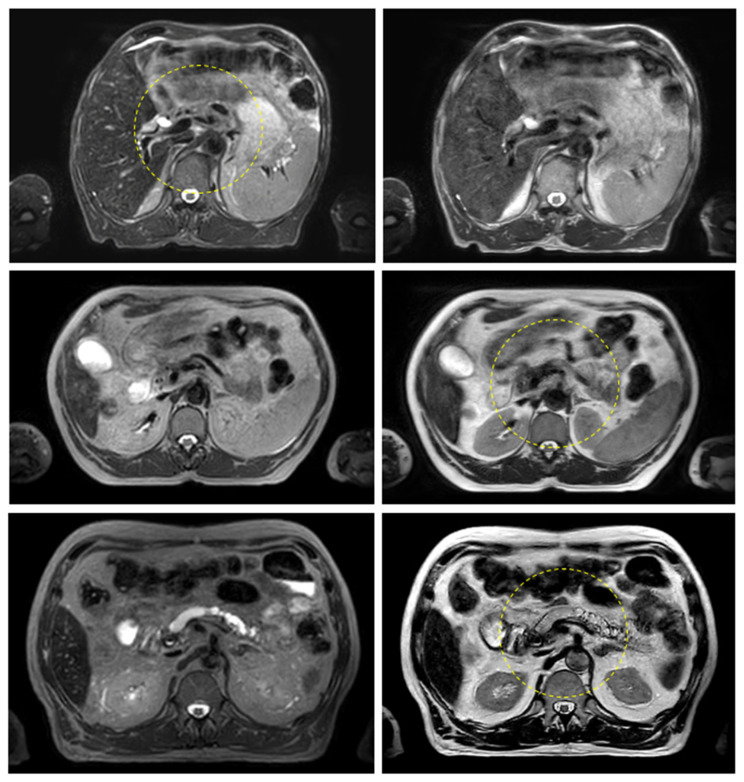
Figure 4.
Pancreas examples highlighting the comparison between the T2w-Nav (first column) and T2w-Ave (second column) image sequences. The target location is identified by the yellow dashed circle. The planning data set was the T2w-Nav for the first case and T2w-Ave for the second and third case. The samples correspond to Patients 11, 14, and 16 as listed in Table 1.

