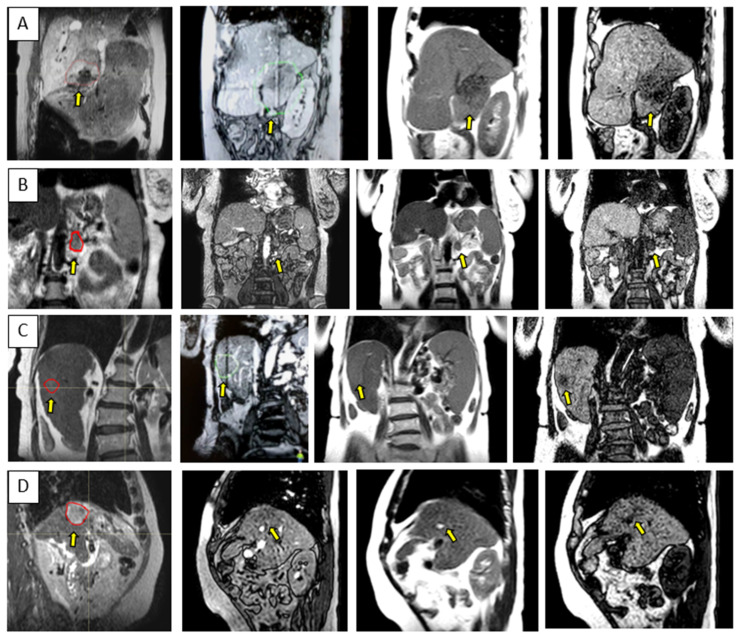
Figure 5.
Sample data for four UGI patients highlighting the range of contrast available with the 3D cine sequences used for the quantification and monitoring of patient setup and target motion. Each row is for a different patient and shows either a coronal or sagittal view: (A–D) corresponds to Patients 10, 15, 6, and 12, as per Table 1. The columns correspond from left to right to the MR planning data set identifying the target location, btFFE cine, T2w-cine, and T1w-cine.

