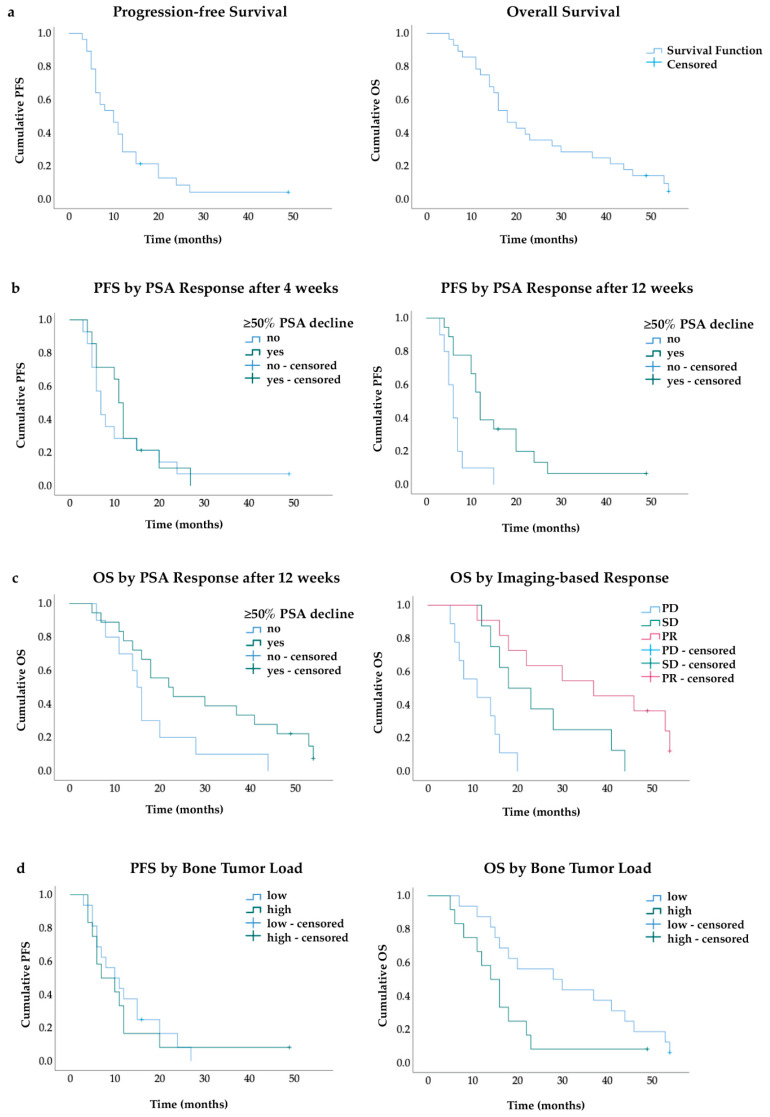
Figure 2.
Kaplan–Meier curves (a) OS and PFS in whole cohort (b) PFS by PSA response after 4 and 12 weeks (c) OS by PSA and imaging-based response (d) PFS and OS by bone tumor load; PFS: progression-free survival, OS: overall survival, PR: partial response, SD: stable disease, PD: progressive disease.

