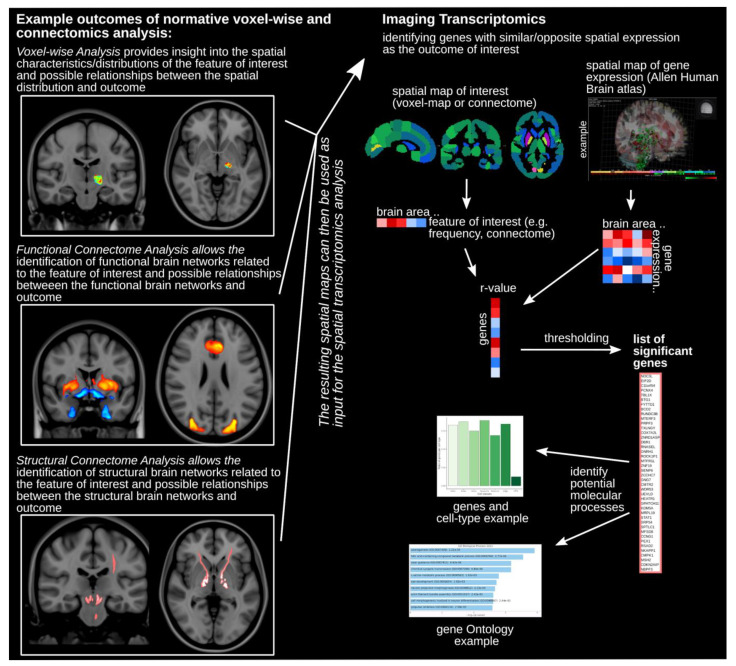
Figure 1.
Normative voxel-based, connectomics, and imaging transcriptomics analyses. Examples of outcome maps depicting voxel-based analysis (top), functional connectomic analysis (middle), and structural connectomic analysis (bottom) are shown on the left side of the figure. The resulting spatial maps of those analyses can then be used as input for the spatial transcriptomics analysis outlined on the right side of the figure. Atlas segmentation is used to calculate the correlation of spatial gene expression and imaging results across all brain areas. The thresholded subset of the list identifies the significantly implicated genes. This list can then be further investigated using, for example, gene ontology analysis.

