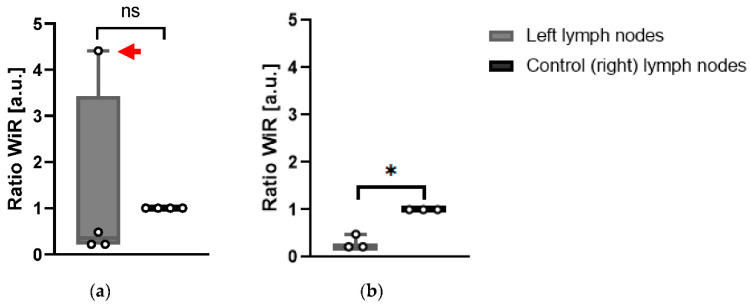
Figure 6.
(a) Wash-in rate ratios of left LNs compared to control (right) inguinal LNs of KPN-injected mice. Red arrow: Mouse 4 tumor-draining LN WiR different from other left LNs (n = 4); (b) Wash-in rate ratios without Mouse 4 (n = 3) (extreme outlier-reason for exclusion indicated in Section 3, Section 4 and Section 5). Paired t-test analysis. ns: p > 0.05; * p < 0.05.

