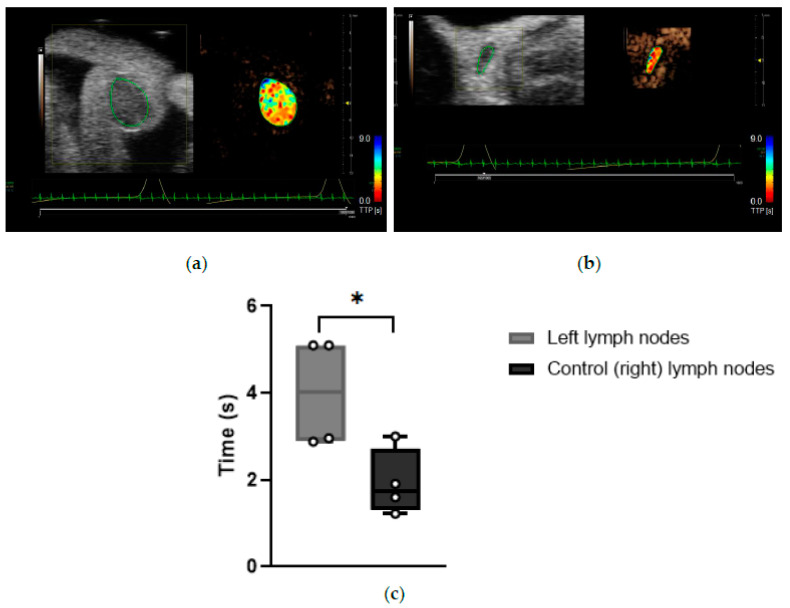
Figure 7.
(a) Representative software analysis image showing time to peak of a tumor-draining inguinal LN. Heat maps represent the time the contrast agent took to reach peak enhancement. Blue: long TTP; red: short TTP. (b) Representative software analysis image showing time-to-peak of a control (right) inguinal LN. Heat maps represent the time the contrast agents took to reach peak enhancement. Blue: long TTP; red: short TTP. (c) Time-to-peak of tumor-draining and control (right) inguinal LNs (n = 4 mice). *: p < 0.05.

