Figure 4.
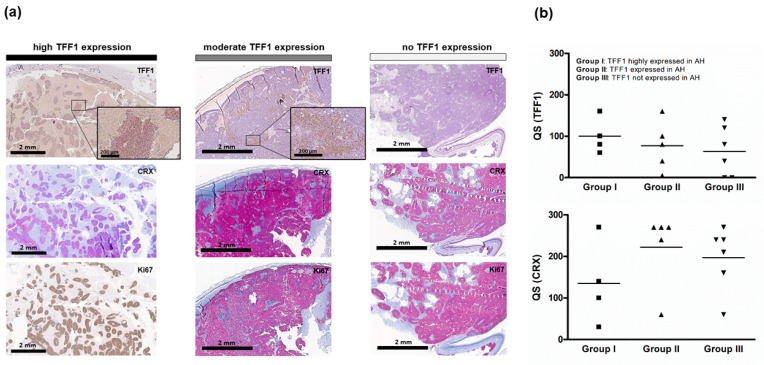
Histological analysis of primary RB tumors. (a) TFF1, CRX, and Ki67 expression levels in exemplary human RB tumor paraffin sections. Immunohistochemistry was revealed using diaminobenzidine detection (brown signal) or alkaline phosphatase detection (red) and hematoxylin counterstaining (blue nuclei staining). Scale bars, 2 mm and 200 µM (zoom box). (b) Dot plots showing the quick score (QS) for TFF1 and CRX in 15 tumors analyzed. One way ANOVA was used to assess the difference of the QS for group I (TFF1 highly expressed in AH) vs. group II (TFF1 expressed in AH) vs. group III (TFF1 not expressed in AH). No significant difference was detectable between the groups. The squares and triangles in (b) represent the different tumors per group.

