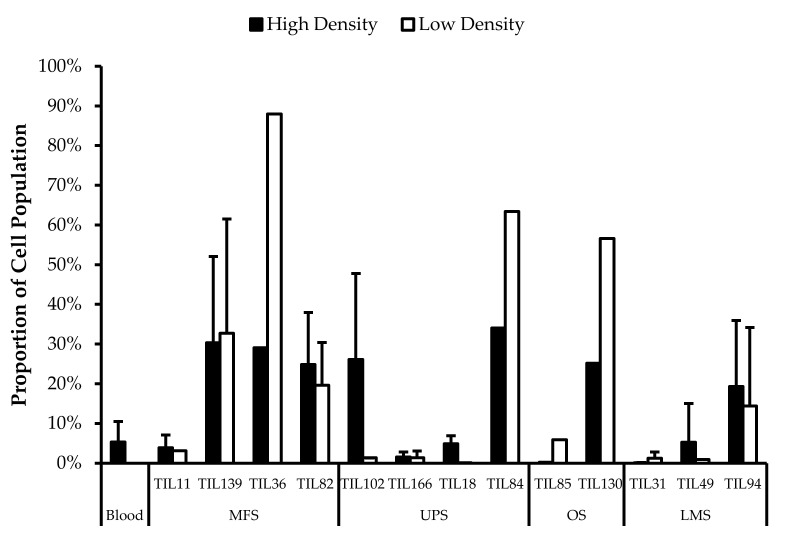
Figure 5.
Comparing CD3−CD56+ cell proportions between “high-density” and “low-density” populations. The graphs represent the TIL composition of “high-density” populations and “low-density” populations (n = 13) of thirteen tumour specimens (4 myxofibrosarcoma (MFS), 4 undifferentiated pleomorphic sarcoma (UPS), 2 steosarcoma (OS), and 3 leiomyosarcoma (LMS). Error bars represent the standard deviation, so bars with error bars indicate the average cell count of biological replicates. Bars without error bars indicate the cell count of one single replicate.

