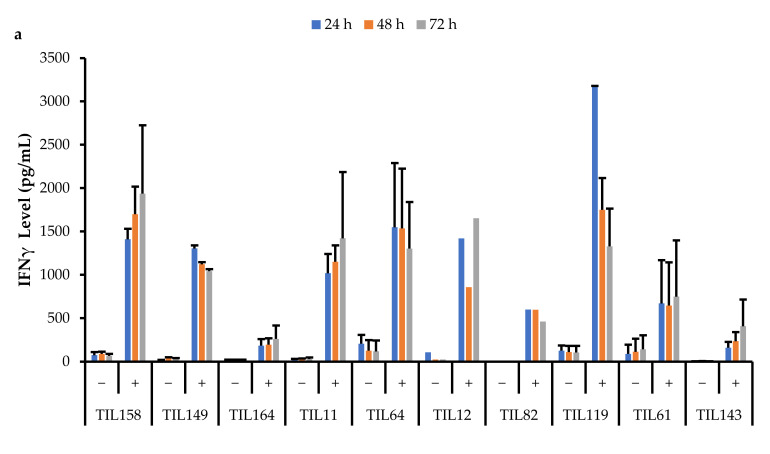
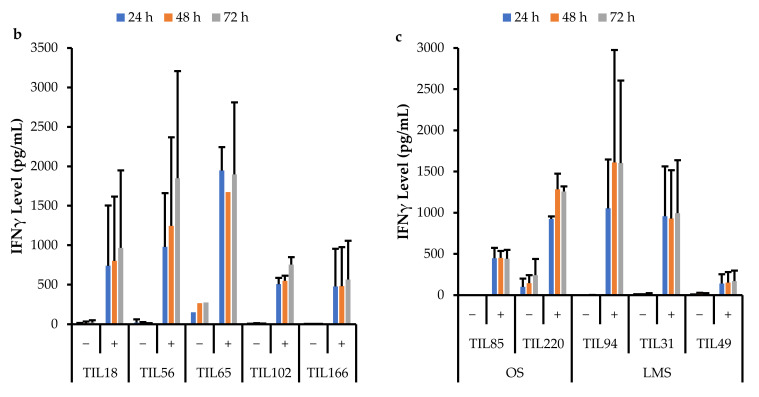
Figure 17.
Comparison of IFNγ release by different TIL populations. The graphs represent the average IFNγ levels at 24, 48, and 72 hr for (a) 10 myxofibrosarcoma (MFS) TIL populations; (b) 5 undifferentiated pleomorphic sarcoma (UPS) TIL populations; (c) 2 osteosarcoma (OS) and 3 leiomyosarcoma (LMS) TIL populations. Error bars represent the standard deviation, so bars with error bars indicate the average IFNγ level of biological replicates. Bars without error bars indicate the IFNγ level of one single replicate.


