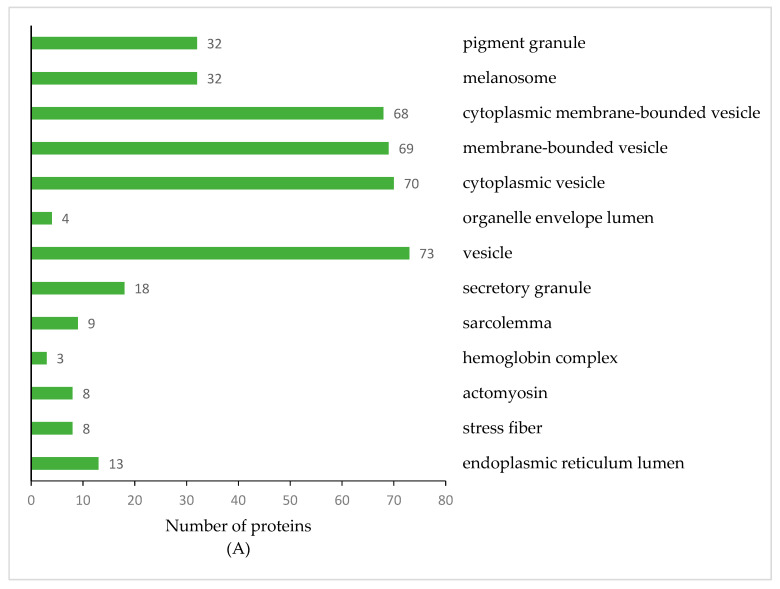
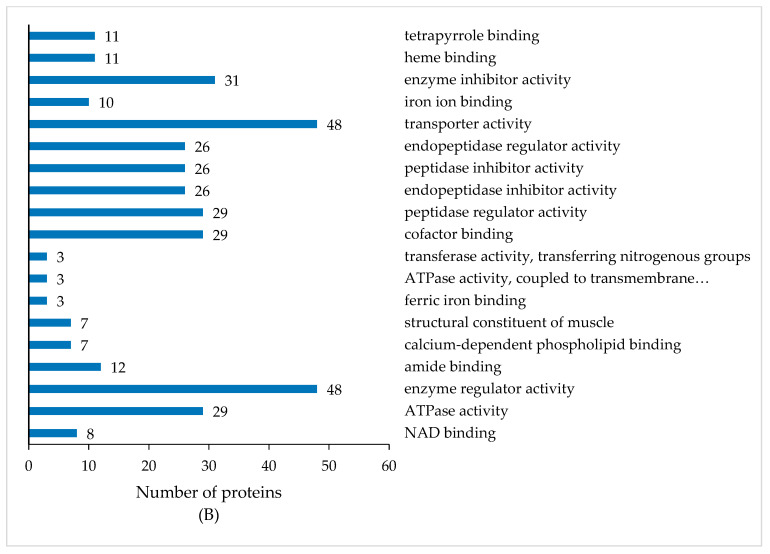
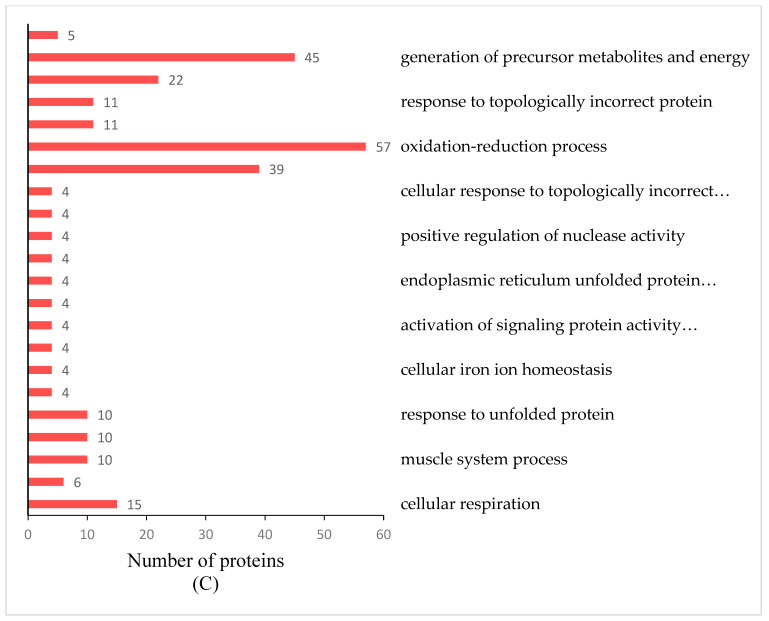
Figure 4.
GO Enrichment Analysis of DEPs. Cellular component ((A); p < 0.05), molecular function classification ((B); p < 0.05) and biological processes ((C); p < 0.01) of differentially expressed proteins according to the GO enrichment analysis. The orders of the columns are arranged according to p-values (low to high).


