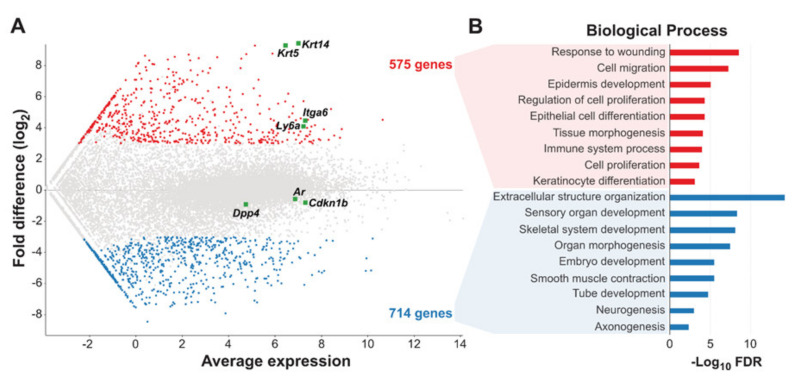
Figure 3.
Gene expression profiling of three individual TRAMP tumors reveals distinct epithelial and neuroendocrine signatures for basal and luminal TRAMP tumor cells. (A) MA plot showing differentially expressed genes between basal (red) and luminal (blue) cells. Each dot represents a unique transcript. X-axis: average transcript expression, Y-axis: log2 difference in gene expression. (B) Barplots showing enriched biological processes in basal-specific (blue) and luminal-specific (red) genes ranked by −Log10 FDR.

