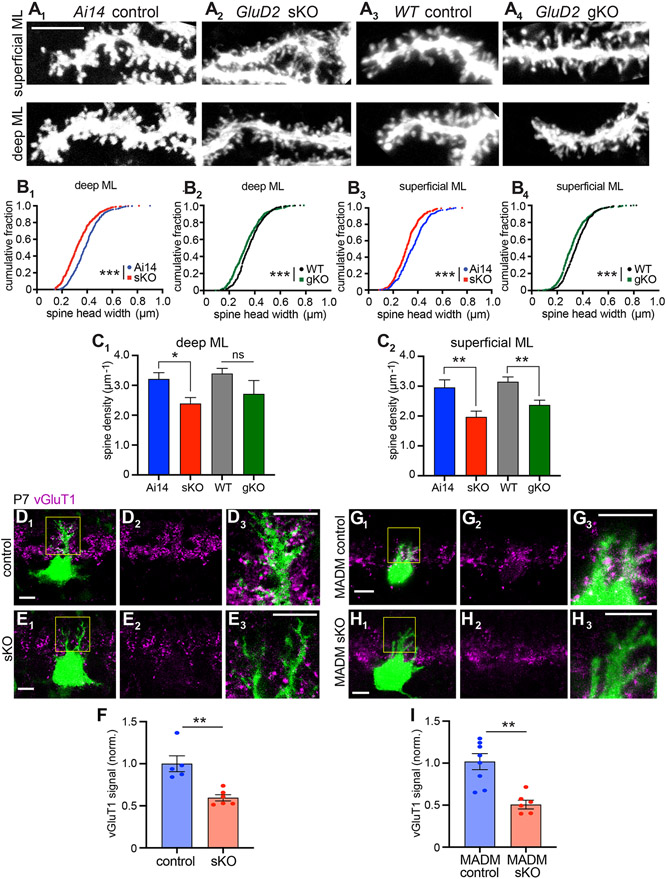
Figure 2. Evidence that GluD2 sKO Disrupts Synaptogenesis.
(A) Representative dendritic segments in the deep (bin 1) and superficial (bin 5) molecular layer showing the morphology of dendritic protrusions in P21 Ai14 control (A1), GluD2 sKO (A2), wild-type (WT) control (A3), and GluD2 gKO (A4) Purkinje cells at P21. Scale bar, 5 μm.
(B) Cumulative distribution of the head widths of dendritic protrusions. n = 444 (Ai14 control), 442 (GluD2 sKO), 405 (WT control), 414 (GluD2 gKO) deep molecular layer protrusions and n = 417 (Ai14 control), 414 (GluD2 sKO), 383 (WT control), 453 (GluD2 gKO) superficial molecular layer protrusions; ***p < 0.001; Kolmogorov-Smirnov test.
(C) Dendritic spine density. Data are mean ± SEM; n = 10 cells for each condition; *p < 0.05, **p < 0.01; ns, not significant (p > 0.05); t test.
For panels B–C, data were collected from from 2 (Ai14 control), 3 (GluD2 sKO), 2 (WT control), 2 (GluD2 gKO) mice.
(D, E, G, H) Representative single-section confocal images of IUE-based (D, E) or MADM-based (G, H) GluD2 sKO Purkinje cells labeled with GFP (D, E, G) or tdTomato (H) (green). Magenta indicates vGluT1 staining to label presynaptic terminals of parallel fibers. D2–3, E2–3, G2–3, and H2–3 are high magnification images (vGluT1 only or vGluT1 with GFP or tdTomato) of D1, E1, G1 and H1 (boxed regions). Scale bars, 10 μm.
(F, I) Quantification of normalized vGluT1 intensities on dendrites from IUE (F) and MADM (I) experiments. Data are mean ± SEM; n = 5 (control), 6 (sKO) cells from 1 control and 1 sKO mice for IUE; n = 8 (control; GluD2+/− ), 6 (MADM sKO; GluD2−/−) cells from 3 mice; **p < 0.01; t test.
See also Figure S3.

