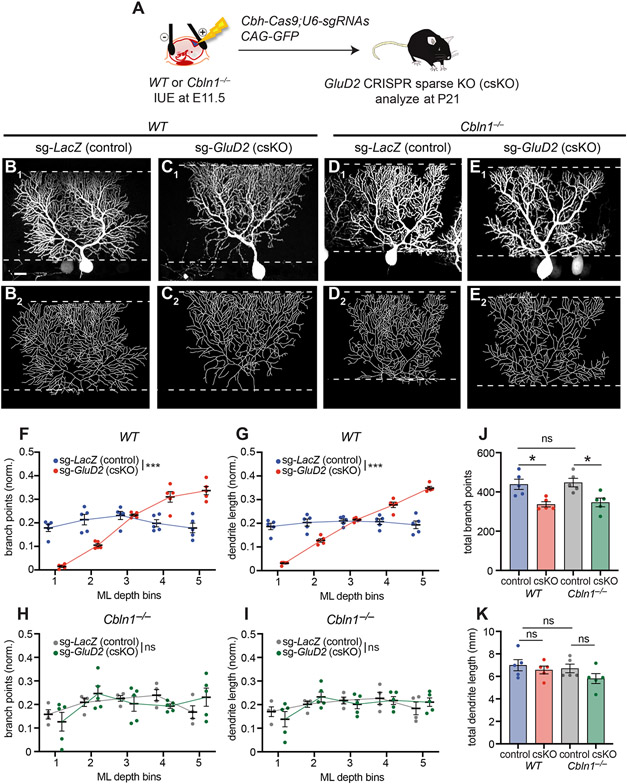
Figure 7. Sparse GluD2 Knockout Phenotypes Are Blocked by Loss of Cbln1.
(A) Schematic of CRISPR-mediated sparse control (LacZ) or GluD2 sKO in Purkinje cells of wild-type or Cbln1−/− mice.
(B, C) Confocal image (B1, C1) and tracing (B2, C2) of a representative wild-type (WT) Purkinje cell expressing Cas9 and sgRNAs against LacZ [sg-LacZ (control), B], or GluD2 [sg-GluD2 (csKO), C].
(D, E) Same as B, C except in Cbln1−/− mice. Scale bar, 20 μm for B–E.
(F–I) Quantification of the normalized number of branch points (F, H) and dendrite length (G, I) of Purkinje cell dendrites in each ML bin in control (sg-LacZ: WT, blue; Cbln1−/−, grey) and GluD2 csKO (sg-GluD2: WT, red; Cbln1−/−, green) in wild-type (F, G) or Cbln1−/− (H, I) animals.
(J, K) Quantification of total number of branch points (J) and dendrite length (K) of sg-LacZ/WT, sg-GluD2/WT, sg-LacZ/ Cbln1−/− and sg-GluD2/ Cbln1−/− cells.
Data from F–K are mean ± SEM; n = 5 cells from 2 mice for each condition; ***p < 0.001; *p < 0.05; ns, not significant; two-way ANOVA (F–I); or one-way ANOVA followed by Sidak’s multiple comparisons test (J, K).
See also Figure S7.

