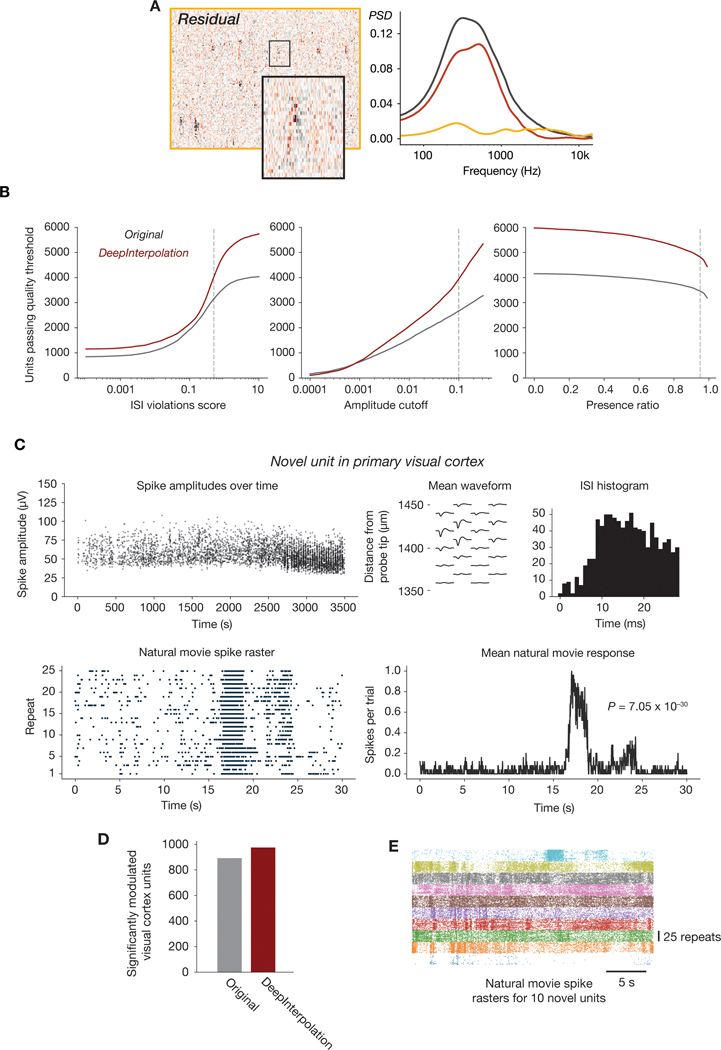
Extended Data Fig. 7. Extended data for Neuropixels recordings.
(A Left: Heatmap of the residual (denoised subtracted from the original data), for the same data shown in Figure 3B. Right: Power spectra for the original (gray), denoised (red), and residual (yellow) data. (B) Number of units passing a range of quality control thresholds, for three different unit quality metrics. QC thresholds used in this work are indicated with dashed lines. (C) Physiological plots for one example unit from V1 that was only detectable after denoising (<20% of spike times were included in the original spike sorting results). (P-value calculated using the Kolmogorov–Smirnov test between the distribution of spikes per trial for the original and shuffled response). (D) Number of units with substantial response modulation to a repeated natural movie stimulus, for all cortical units detected before and after denoising. (E) Raster plots for 10 high-reliability exemplar units detected only after denoising, aligned to the 30 s natural movie clip. Each color represents a different unit.

