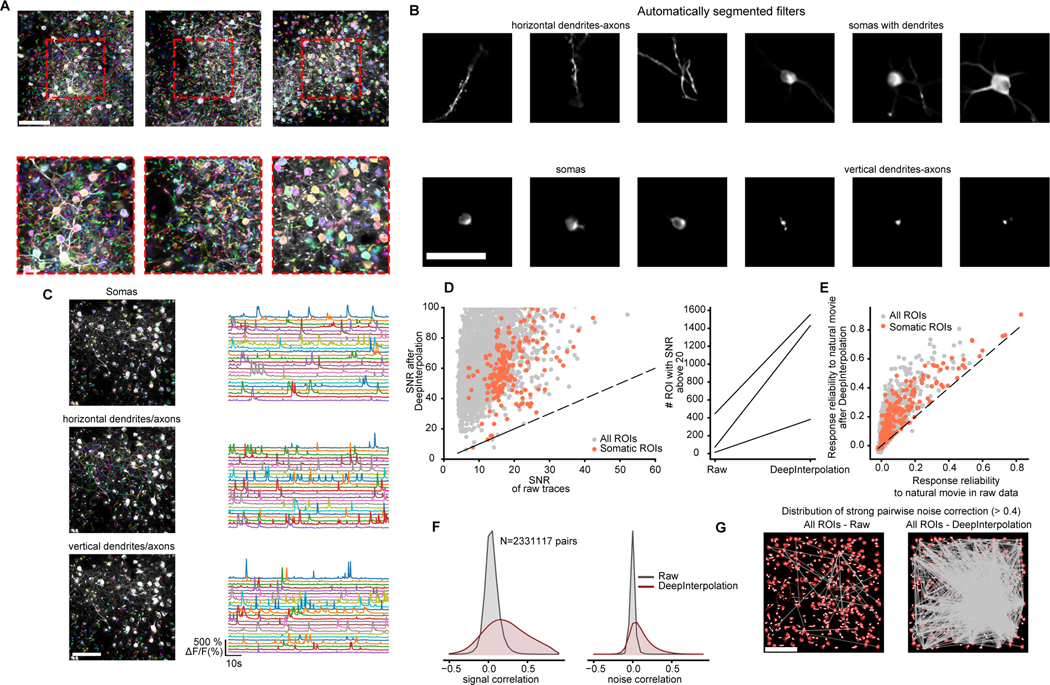
Fig. 2 |. Applying DeepInterpolation to Ca2+ imaging reveals additional segmented ROIs and rich network physiology across small and large neuronal compartments.
(A) Three examples showing overlaid colored segmentation masks on top of a maximum projection image. Red dashed boxes show zoomed-in view. Scale bar is 100 μm. (B) Example individual weighted segmented filters showcasing dendrites, isolated somas, somas with attached dendrites, and axons and small sections of dendrites or axons. Scale bar is 50 μm (C) Manually sorted ROIs from one experiment showcasing the calcium traces extracted from each individual type of neuronal compartments (from top to bottom - cell body, horizontal processes, processes perpendicular to imaging plane). (D) Left: Quantification of SNR for all detected ROIs (gray dots) and somatic ROIs (red dots) with and without DeepInterpolation. Dashed line represents the identity line. Right: Comparison of the number of ROIs with an SNR above 20 with and without DeepInterpolation. Each line is a single experiment (n = 3 experiments). (E) Quantification of the response reliability of individual ROIs across 10 trials of a natural movie visual stimulus. Dashed line represents the identity line. (F) Left: signal correlation (average correlation coefficient between the average temporal response of a pair of neurons) for all pairs of ROI in (D) for both raw and denoised traces. Right: noise correlation (average correlation coefficient at all time points of the mean-subtracted temporal response of a pair of neurons) for all pairs of ROIs in (D). (G) For an example experiment, pairs of ROIs with high noise correlation (>0.4) are connected with a straight line for both original two-photon data and after DeepInterpolation. Scale bar is 100 μm.

