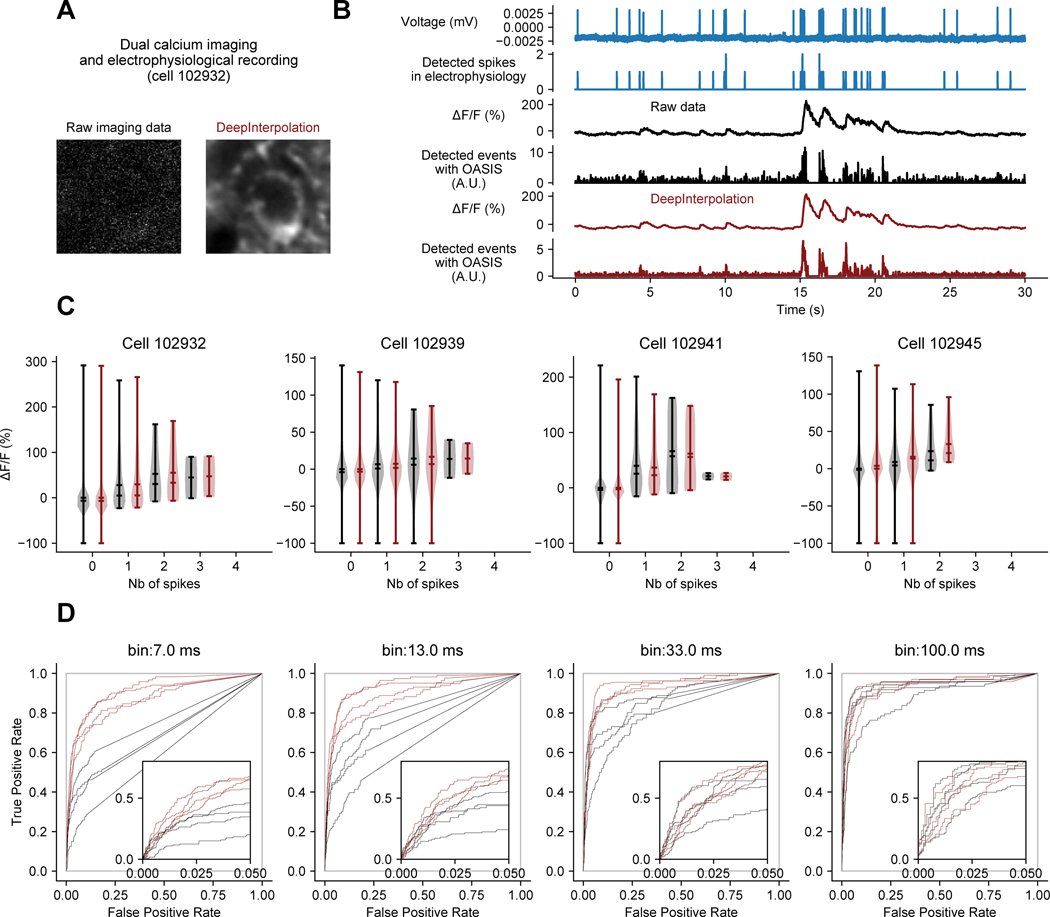
Extended Data Fig. 3. Quantification of DeepInterpolation impact on spike detection performance using high-quality simultaneous optical and cell-attached electrophysiological recording.
(A) Example high-magnification single two-photon frame acquired during a dual calcium imaging and cell-attached cellular recording in vivo in a Camk2a-tTA; tetO-GCaMP6s transgenic mouse. Cell id throughout the figure refers to the available public dataset cell ids14 (B) Exemplar simultaneous voltage cellular recording, detected Action Potential (AP), original fluorescence recording, denoised trace with DeepInterpolation and detected events using fast non-negative deconvolution39 based either on the original or the denoised data. (C) Violin distribution plots of ΔF/F amplitude associated with number of recorded action potentials in 100 ms bins. Raw traces (black) and traces after DeepInterpolation (red) are shown for 4 different recorded cells. (D) Receiver operating characteristic (ROC) curves showing the detection probability for true APs against probability of false positives as detection threshold is changed, for one or more spikes. ROC curves were calculated for 4 different temporal bin sizes. False positives were calculated from time windows with no spikes. Each ROC curve represents a different cell id. Red curves are obtained after DeepInterpolation. Inset plots zoom on lower false positive rates.

