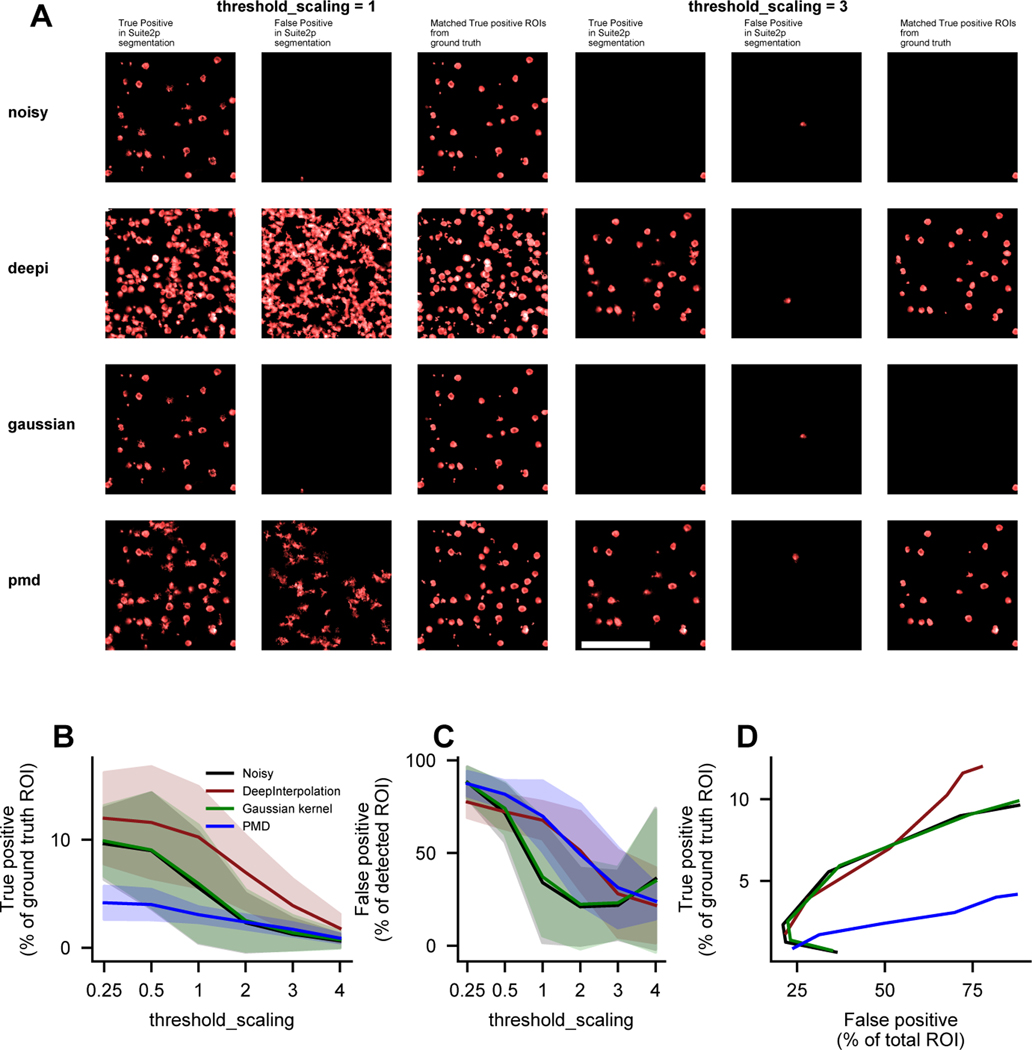
Extended Data Fig. 4. Quantification of DeepInterpolation impact on segmentation performance of Suite2p with synthetic data from NAOMi.
(A) The noisy raw movie (first row) was pre-processed with either a fine-tuned DeepInterpolation model (second row), a gaussian kernel (third row), or using Penalized Matric Factorization (PMD) (fourth row). The first column shows the ROIs or cell filters identified by Suite2p that were matched with corresponding ideal ROIs in the ground truth synthetic data (cross-correlation > 0.7). The second column shows ROIs that could not be matched (cross-correlation < 0.7) with any ideal ROI in the synthetic data. The third column shows the ideal ROIs projection in the synthetic data that were matched with a segmented filter (i.e. not the ROI profile that were found using suite2p but the expected ROI from the simulation). Two sets of segmentation are displayed for two values of threshold_scaling, a key parameter in suite2p controlling the detection sensitivity. Scale bar is 100 μm. (B) True positive rate, i.e. the proportion of ROIs in the simulation that were found by suite2p. threshold_scaling was varied from 0.25 to 4 (default is 1) for every datasets. N=4 simulated movies. Shaded area represents the standard deviation across 4 simulations. (C) False positive, i.e. the proportion of found ROIs that were not found in the simulated set of ideal ROIs (cross-correlation <0.7). N=4 simulated movies. Shaded area represents the standard deviation across 4 simulations. (D) True positive rate against false positive rate for each pre-processing method.

