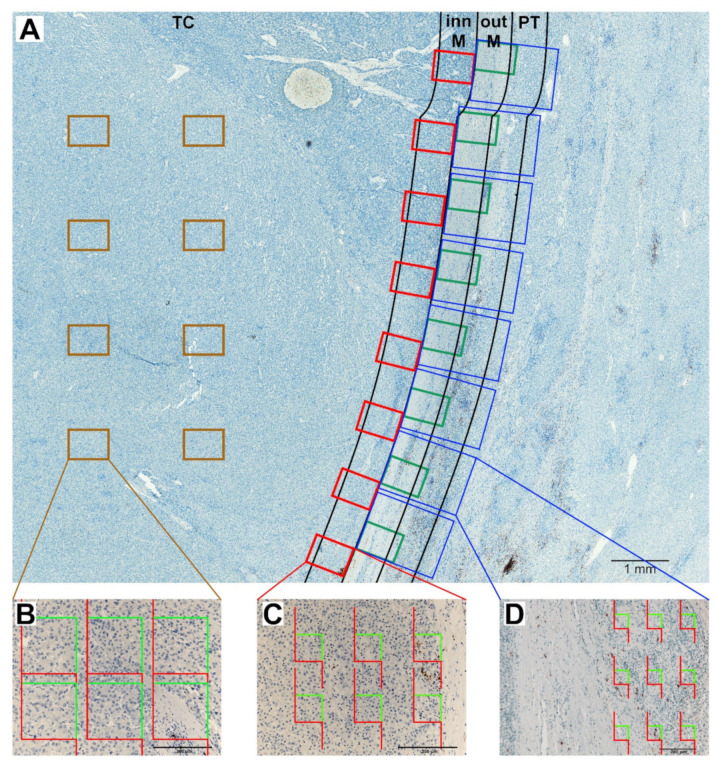
Figure 2.
Immunoperoxidase staining for CD20+ lymphocytes in hepatocellular carcinoma. (A) Regions of interest (ROIs) are denoted: TC (tumor center), inn M (inner margin), out M (outer margin), PT (peritumor liver). The inn M and out M were defined as 500 µm on each side of the border separating the malignant cell nests and adjacent non-tumor tissue. The TC represented the remaining tumor area. The PT region was defined as the 500 µm thick region immediately adjacent to the out M. Eight equidistant fields of view (FOV) were taken from each ROI using systematic uniform random sampling. To sample TC, inn M and out M objective 20× was used, whereas objective 10× was used for PT region. This figure shows an example of low density of CD20+ nucleated cell profiles in the TC and inn M. (B–D) CD20+ nucleated cell profiles were counted using sets of unbiased counting frames. Examples of counting in single FOV in the TC with low density of CD20+ nucleated cell profiles (B), in the inn M (C), and in the PT liver (D). Scale bars 1000 µm (A), 200 µm (B–D).

